

Understanding Order Flow Trading
At its core, every financial market operates as an ongoing auction. Buyers compete to purchase at the lowest possible price, while sellers compete to sell at the highest. This constant negotiation between supply and demand is what causes price movement, and order flow trading is the process of reading that negotiation as it happens, in real-time.
Unlike traditional technical analysis, order flow trading isn’t about prediction or relying on indicators. It’s about studying the actual transactions taking place, observing where buyers and sellers are entering, identifying which side is being aggressive, who is absorbing that aggression, and where control shifts between the two. Every tick, every trade, every change in the bid or ask tells a small part of that ongoing story.
The Market as a Continuous Auction
The market is a live, continuous auction. But instead of an auctioneer shouting bids, traders from around the world are constantly placing and executing orders. Every one of those transactions is a small negotiation between buyers and sellers that defines the next price.
At any moment, two types of participants are interacting:
Limit Orders (Passive Liquidity)
Limit orders are placed in advance at specific prices and wait for the market to come to them.
- A buy limit order adds liquidity to the bid side. The trader is willing to buy, but only at that price or lower.
- A sell limit order adds liquidity to the ask side. The trader is willing to sell, but only at that price or higher.
These orders do not move the price. They sit on the book, providing liquidity for others who want to trade immediately.
Market Orders (Aggressive Liquidity Takers)
Market orders are placed by traders who want to enter or exit the market right now, regardless of price. They represent urgency — the willingness to take whatever price is available.
- A buy market order accepts the current offer and buys from whoever is selling at the ask.
- A sell market order hits the current bid, selling immediately to whoever is buying.
These orders are what move the price. They consume the liquidity that passive traders have provided.
Why Price Moves
Price doesn’t rise because there are “more buyers than sellers” — that’s a myth. For every buyer, there’s always a seller. What actually drives movement is the intensity of aggression between them.
- When buyers are more aggressive, they lift offers and push the price higher.
- When sellers are more aggressive, they hit bids and push the price lower.
- When both sides are equally aggressive, the price balances and consolidates.
This constant tug-of-war between aggressors and passives — between those demanding liquidity and those providing it — shapes every move you see on a chart. Understanding this interaction gives you insight into why the price is moving, not just that it’s moving.
What Candles Really Represent
A candlestick is simply a summary of the auction that occurred within a specific period of time.
- The open and close show where that auction began and ended.
- The high and low mark the extremes of the negotiation.
But what a candle doesn’t reveal is how those prices formed. You can’t see which side was in control, where large traders stepped in, or how efficiently the price moved between levels.
That’s the gap order flow analysis fills. Instead of only seeing the result of a candle, you see the process: who was buying or selling, who was aggressive or passive, and whether momentum was building or fading. It’s like looking under the hood of the market’s engine rather than just watching the car drive by.
Why Support and Resistance Form
Support and resistance are not magical lines or indicators. They exist because one side of the auction continually absorbs the other.
- At resistance, large passive sellers are waiting to sell at or near a certain price. Every time buyers try to push higher, their market orders are absorbed by these resting sell orders. When buying momentum fades, the price turns lower.
- At support, large passive buyers sit with limit orders waiting to buy. When aggressive sellers hit those bids but can’t push through, the selling pressure fades, and the price bounces.
What looks like a “turning point” on a chart is simply the area where aggressive orders fail to overpower passive liquidity.
The Real Structure Behind Price
Every trade has two sides: one taking liquidity and one providing it. The balance between these two forces decides whether the price holds, breaks, or reverses.
- Aggressive participants reveal intent — they’re showing urgency, willing to trade immediately at any price.
- Passive participants reveal conviction — they’re waiting for the price to come to them and are confident in their level.
The Three Core Order Flow Signals
There are three main order flow signals that appear across every market and trading style. Understanding these helps you see when momentum is building, when it’s weakening, and when a reversal is likely forming.
Absorption
Absorption happens when aggressive orders hit the market, but the price barely moves. It means the opposite side — the passive traders are strong enough to absorb that pressure.
For example, if aggressive buyers keep lifting the ask with large volume but the price isn’t rising, it shows strong sell-side liquidity sitting there, quietly taking in all that buying. This often signals that buyers are getting trapped and that price could soon move lower.
The same idea works in reverse: when heavy selling fails to break a low, it means buyers are absorbing that pressure, and a reversal upward might follow.
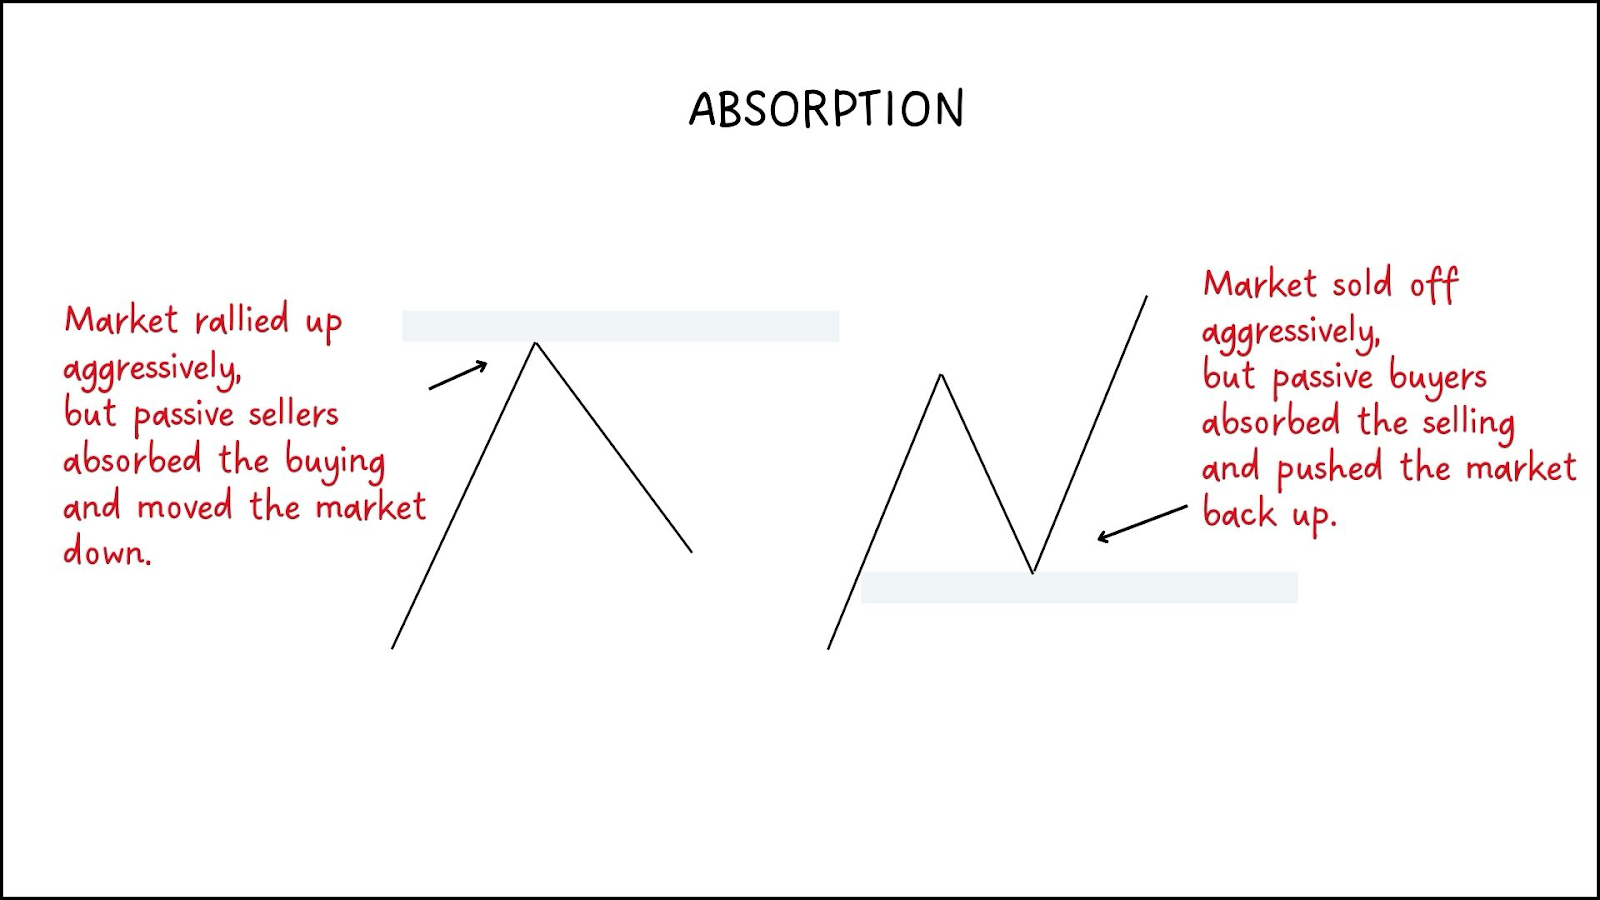
In short, absorption shows where one side is defending a level, revealing key turning points in the auction.
Liquidity Wall
A liquidity wall is a large cluster of limit orders visible on the order book or heatmap. These act like temporary barriers where price tends to stall or reverse.
For example:
- Price moves up into a level with a large group of resting sell orders.
- Buyers hit into it repeatedly but can’t clear the wall.
- Once their buying pressure fades, the market pulls back.
That visible wall represents strong passive liquidity — a clear sign of resistance. Likewise, a wall of resting buy orders can create support.
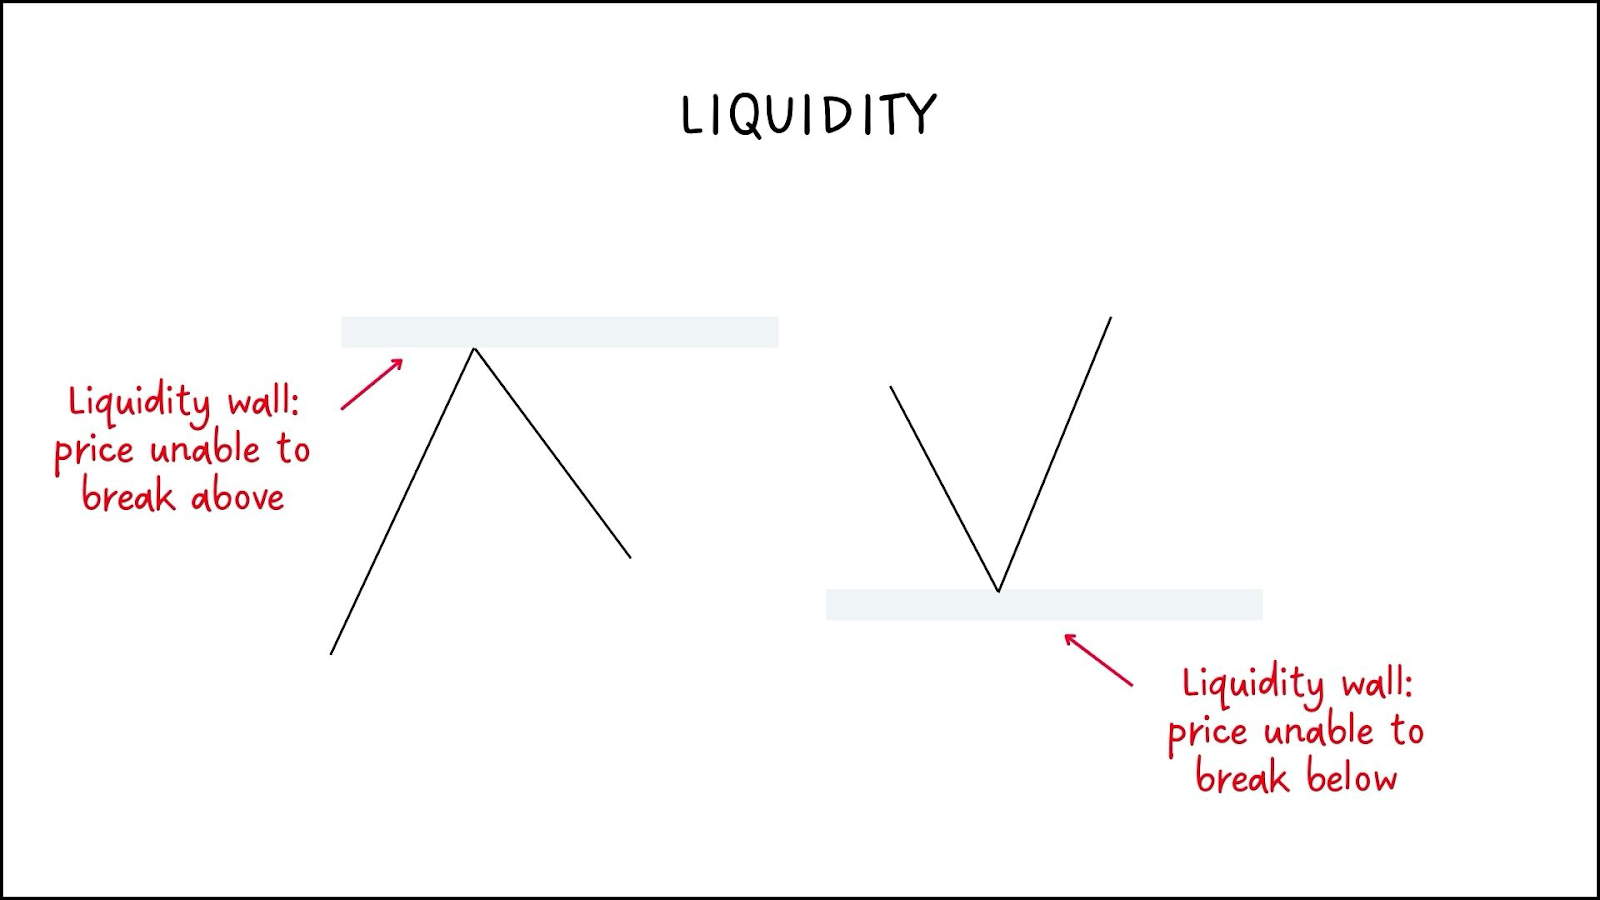
These areas don’t always cause reversals, but they show where large participants are active, and where short-term reactions often occur.
Stop Runs (Stop Hunts)
A stop run happens when the market pushes through obvious highs or lows to trigger stop losses and grab liquidity before reversing.
Here’s how it works:
- The market builds up liquidity as traders place stops above a recent high or below a recent low.
- Price breaks that level sharply, triggering those stops and releasing a burst of market orders.
- Once those orders are filled, the market often snaps back in the opposite direction.
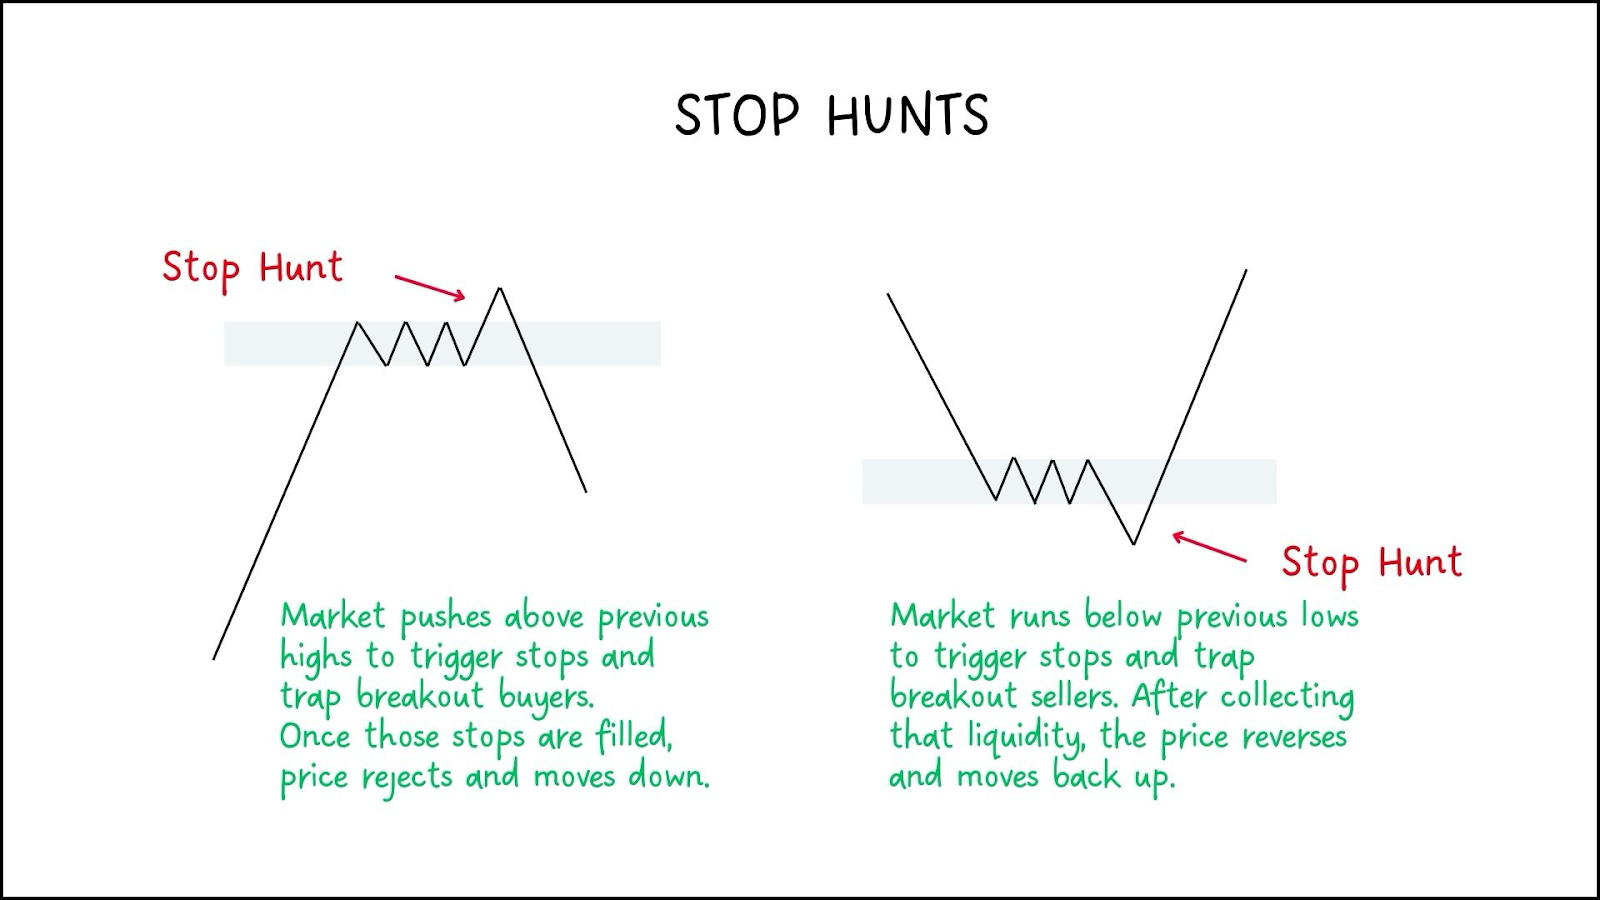
This happens because large players need liquidity to enter their trades. They push price through obvious stop levels to get those fills — a process often called a liquidity grab.
A stop run tells you where the auction has reached an extreme — a price level where interest in continuing higher or lower suddenly disappears.
Reading Delta and Volume Profile
Once you understand liquidity and absorption, the next step is learning to read delta and the volume profile. Both help you see what’s happening inside the candle, who was aggressive, who got trapped, and where the market found balance.
Delta
Delta shows the difference between aggressive buyers and aggressive sellers. It tells you which side hit the market harder.
- Positive delta: buyers were more aggressive.
- Negative delta: sellers were more aggressive.
But the key is not just the number, it’s how the price reacts to it. If you see a strong positive delta but the price fails to move higher, it means buyers were absorbed by passive sellers.
If you see a strong negative delta but the price doesn’t move lower, sellers were absorbed.
Delta shows you the intent of participants, but absorption tells you the result. Together, they show whether the move has real strength or if one side is trapped.
Volume Profile
The volume profile shows how much is traded at each price level. It helps you see where the market accepted the value and where it rejected it.
How to Identify These Signals with Order Flow Tools
You can read the order flow through three main tools: the DOM, the Heatmap, and the Footprint Chart. All three show the same auction process, but each gives you a different layer of information.
DOM (Depth of Market):
The DOM shows resting limit orders — the buyers on the bid and the sellers on the ask — and you can also see transactions printing in real time as market orders hit those levels. It helps you see where liquidity is sitting and how quickly it’s being taken or replenished.
However, the DOM only shows what’s happening right now — it doesn’t display the full historical behavior of liquidity over time like a heatmap does.
Heatmap:
The heatmap shows liquidity and how it changes over time, while also letting you see transactions as they occur.
You can watch large buy or sell orders appear, hold their ground, get hit, or get pulled away, and see how the price reacts in real time.
This makes it easier to identify absorption and liquidity walls, because you can see whether those heavy resting orders are actually getting traded into or absorbing aggressive orders. It gives you both the history of liquidity and the live interaction between buyers and sellers.
Footprint Chart:
The footprint chart displays executed volume at each price, showing exactly how much traded on the bid and ask, and whether buyers or sellers were more aggressive.
It gives you the most detail, showing delta, volume, and imbalance, which helps you spot trapped traders and confirm absorption.
Case Studies
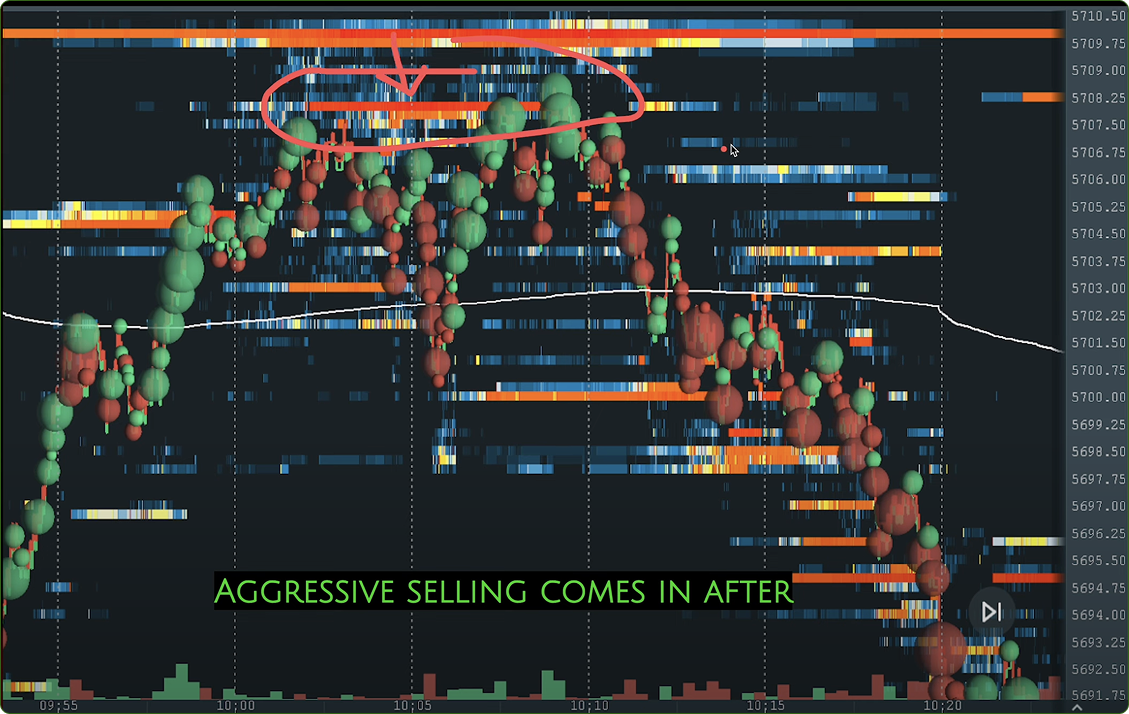
Absorption Short at Resistance
Price was moving up toward a resistance level where a large wall of sell limit orders, about 111 contracts, sat around 5710.
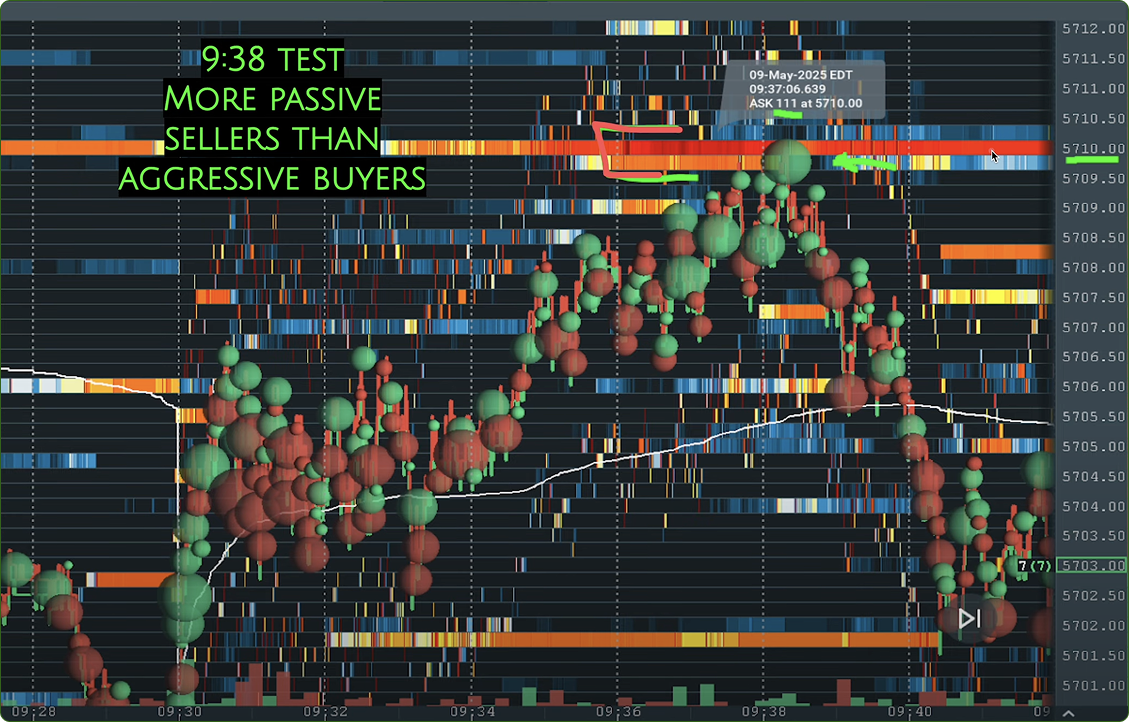
As the price approached that wall, aggressive buyers kept lifting the offers, trading into it with around 70–80 contracts at a time. The delta showed strong positive buying, yet the price wasn’t moving higher.
That’s a clear sign of absorption — passive sellers sitting at that level were taking in all the buy orders without letting the price break through.
Once buying momentum started to fade and bids below began thinning out, sellers stepped in aggressively, flipping control.
Price quickly rejected 5710 and rotated lower, confirming the shift in control.
This is an absorption short setup, aggressive buyers trapped into resistance while passive sellers absorb and take over.
Stop Run and Reclaim Long
The price flushed below the previous day’s low, triggering a wave of stop-loss orders and aggressive selling.
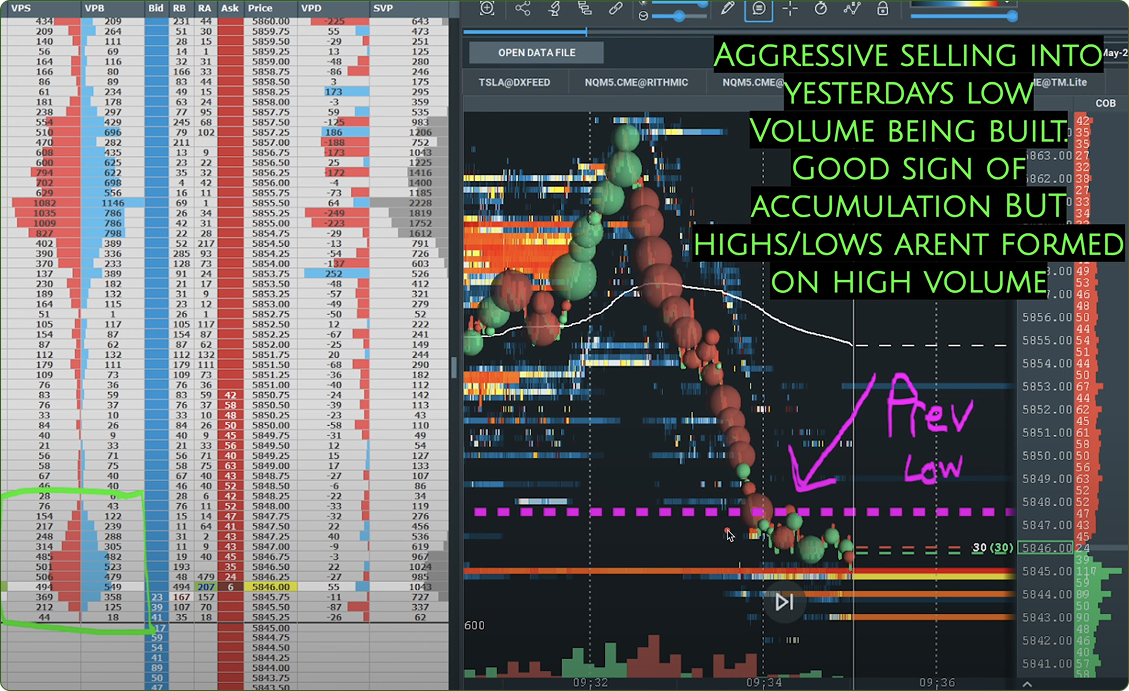
Heavy negative delta printed as sellers hit the bids hard, but price stopped moving lower — showing clear absorption at the lows.
Even with strong selling pressure, buyers were quietly stepping in and holding the level.
The footprint confirmed aggressive selling without continuation, and the heatmap showed liquidity forming below price.
Once the price reclaimed the previous day’s low, that confirmed buyers had absorbed the selling. The shift in control was clear — trapped sellers were now forced to cover.

The long entry came on the reclaim, around 5844, with a stop just below the low of the flush.
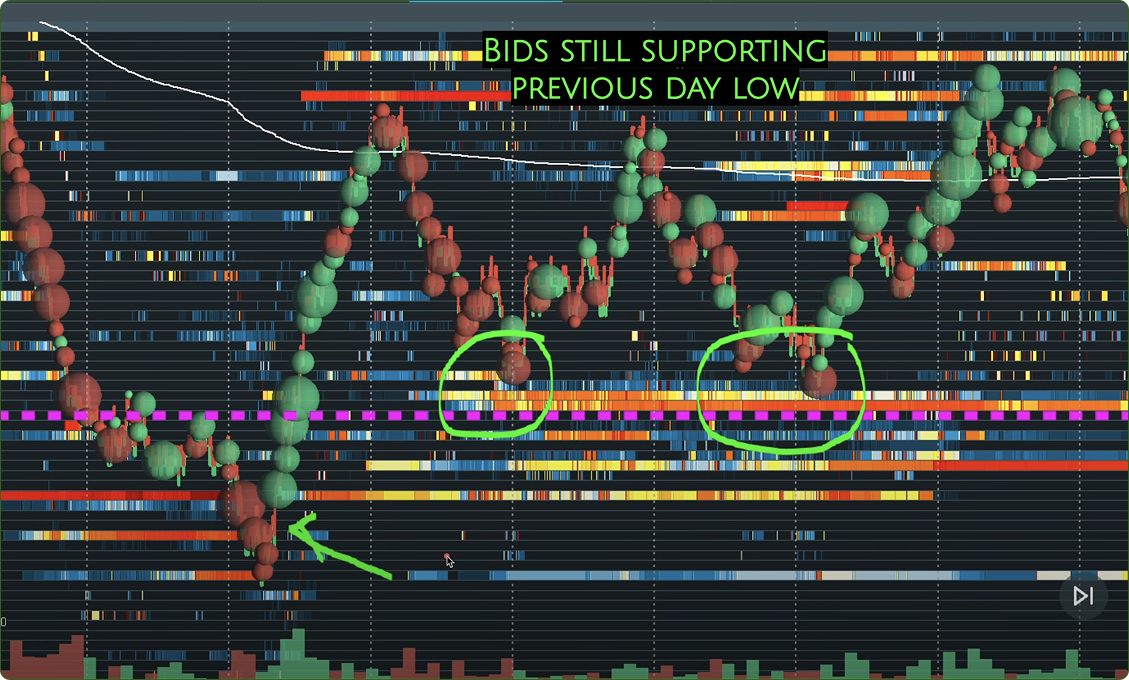
As sellers exited, price moved sharply higher, producing a clean reversal long setup based on stop run + absorption + reclaim.
The 5844 area wasn’t random. It had already acted as support four or five times earlier in the session, and each test showed buyers stepping in and holding the line. So when price finally ran that level and then reclaimed it, it confirmed that those same buyers were still active — and that’s what made the reversal so powerful.

In the end, it all comes down to reading the auction for what it really is — a constant negotiation between buyers and sellers.
When you apply Context, Location, and Confirmation, you’re no longer reacting emotionally or guessing direction. You’re reading intent, waiting for proof, and stepping in only when the market confirms it.
That’s the difference between chasing setups and understanding the story behind every move.
Order flow isn’t about prediction; it’s about observation, patience, and recognizing when one side takes control.
When you learn to see that shift happen in real time, trading stops being random; it becomes structured, logical, and repeatable.


.svg)

.svg)