

Built For
Instruments: Futures (NQ)
Trading Style: Day Trading
Strategy Overview
The 80/20 Strategy is a NASDAQ-based intraday model built around how the price reacts at levels ending in 20 and 80. These levels consistently act as areas where price pauses, rejects, or reverts, especially during high-volatility sessions.
The strategy is not designed to chase trends or predict large directional moves. Instead, it focuses on entering with precision when the price reaches a key level and begins to show a clear reaction. From there, the goal is to capture a controlled move with tight risk, secure a quick first profit, and allow the remainder of the trade to continue if conditions support it.
At its core, the model combines location and structure. The level provides the location, but the trade is only taken when price action confirms the idea through a recognizable pattern. The edge comes from stacking these elements together, not relying on any single signal.
Market Focus
This strategy is designed primarily for the NASDAQ. The 20 and 80 price endings are the core reference points, and the model is built around the way price tends to respond to those levels on this instrument.
The same market structure concepts can appear on other charts, but the level-based part of the model is built specifically around NASDAQ behavior.
Timeframes
The strategy uses two timeframes.
The 10-minute chart is used for broader structure and context.
The 200-second chart is used for execution. This chart gives a more detailed view of short-term price behavior while still keeping the structure clean enough to trade from.
Core Idea
The foundation of the strategy is simple.
When NASDAQ approaches a price ending in 20 or 80, that area becomes important. Price may reject, stall, reverse, or briefly overshoot before rotating back. Those reactions create opportunities, but only when the surrounding structure supports the trade.
The level provides the location. The structure provides the reason to enter.
That structure comes from four main components:
- The 20/80 level
- The Fork
- The H pattern
- The Cross-Section entry
- The Repair, which acts as a magnet or target
The strongest trades appear when several of these components line up at the same time.
Market Conditions
This strategy performs best when the market is active and moving with intent. The New York open is typically the most favorable time, as volatility is high and the price reacts more cleanly around key levels.
Slow conditions, especially during the lunch hour, tend to reduce the effectiveness of the model. When price is drifting without clear direction or structure, setups become less reliable and easier to misread.
Interestingly, the strategy can still work in choppy conditions, but only when that chop produces clear reactions and defined structure. The problem is not the chop itself, but slow, indecisive movement.
Risk Model
Risk is built around a fixed 10-point stop.
That fixed stop is one of the most important parts of the strategy. It keeps risk controlled, forces precision, and helps filter out poor entries. If a setup cannot be taken with a clean 10-point stop, it is usually not the type of entry this model is built for.
The first scale is generally taken at 15 points. Once that first target is reached, the stop is moved to break even and the rest of the trade is managed based on momentum, structure, and available room.
This creates a simple trade management model:
Enter with tight risk, secure the first scale quickly, remove downside exposure, and then let the remainder work only if the price continues to behave properly.
Understanding the Levels
The strategy focuses on the final two digits of the price.
If NASDAQ is trading at 25,680, the focus is on the 80 level. If it is trading at 25,620, the focus is on the 20 level.
Price does not always need to hit these levels exactly. In many cases, the reaction may occur slightly before or slightly beyond the level. What matters is the behavior of price, not perfect precision.
If the price reacts before reaching the level and moves away, the trade is simply missed. There is no chasing. The next opportunity is always preferred over forcing an entry.
Strategy Setups
The Fork (Reversal Setup)
The Fork is a long reversal pattern that forms after a strong move down.
It begins with aggressive selling, usually after the price has already moved sharply lower. That move is followed by a candle that shows rejection from the lows, often with a long lower wick and a smaller real body. This candle marks the point where selling pressure begins to weaken and buyers begin to respond.
The entry develops when the next candle tests the low of that rejection area but fails to break it. Once the downside fails to continue and price begins to push back higher, the setup becomes valid.
The Fork is not just a random bounce pattern. It is a failed continuation lower followed by the first sign of reversion. That is what makes it useful in this model. It often appears near a 20 or 80 level, and when it does, the setup becomes much stronger.
The ideal Fork entry has three things:
A key level nearby, a failed attempt to continue lower, and room for price to revert back into a target or magnet.
The H Pattern (Continuation Setup)
The H pattern is a short continuation structure.
It forms after a move lower, followed by a bounce that fails to become a real reversal. Instead of continuing higher, the price begins to roll over and build a structure that resembles a lowercase h. This pattern reflects a market that tried to bounce, could not sustain it, and is now preparing to continue lower.
The H is not the exact trigger by itself. It is the structural condition that sets up the short. The actual entry usually becomes more precise when it is paired with the Cross-Section.
The strongest H patterns usually form after a bounce into an 80 level, especially when the price reaches that area with a sharp push, rejects it, and then starts rolling over. That creates a short-term continuation setup with a clear invalidation point and the potential for a larger downside move.
The Cross-Section Entry
The Cross-Section is the precision-entry model within the strategy.
It comes from the overlap or intersection area created by two important candles. When price returns to that area and reacts, it creates a focused entry point that allows the trade to be taken with a tight stop.
This entry can appear inside an H pattern, but it does not need to. It can also be used in general continuation or reversion setups when the structure is clear.
The main purpose of the Cross-Section is refinement. Instead of entering loosely around a broad zone, it narrows the entry down to a more specific area. That helps preserve the 10-point stop and improves the overall reward-to-risk profile.
When a Cross-Section lines up with a 20 or 80 level, the setup becomes much stronger.
The Repair (Magnet Concept)
The Repair is one of the most important concepts in the model.
A Repair is a candle that begins without a wick on one side. In practice, this creates an area that acts like a magnet for price. It represents an area where the move was so aggressive that no proper interaction took place there, which often causes the price to revisit that zone later.
A bearish candle with no upper wick can act as a magnet above the price. A bullish candle with no lower wick can act as a magnet below the price.
The Repair is often used as a target rather than the direct entry itself. For example, a Fork may form below an untouched Repair, making that Repair a natural upside objective. On the short side, an H pattern may roll over toward a lower Repair, which then becomes a logical downside target.
This concept becomes much more powerful when combined with the rest of the structure. A level, a clean entry pattern, and a nearby Repair create a much stronger trade than any one part alone.
Entry Rules
A valid setup should be built around Confluence, not just a location.
The cleanest entries usually form when the price is at or near a 20 or 80 ending, a recognizable structure is present, and the trade can still be taken with a tight stop. The entry itself should come from a clear reaction, not from anticipation alone.
The best setups usually include:
A key level, a clean structure pattern, a refined entry point, and an obvious target.
When those pieces are missing, the setup becomes weaker even if the trade still works occasionally.
Trade Management
The first target is usually taken at 15 points to cover risk and reduce exposure. Once that first scale is taken, the stop is moved to break even. From there, the rest of the position is allowed to continue only if price keeps moving cleanly.
If momentum remains strong, the runner can stay open. If price begins to stall, chop, or lose its structure, the remainder should be reduced or closed.
This creates a model built around base hits first, with runners treated as an extra benefit rather than the entire purpose of the trade.
Execution Notes
This strategy is built to be fast and practical. It does not depend on indicators, order flow tools, or complicated confirmations. The edge comes from reading price directly, recognizing recurring structure, and knowing when those reactions are clean enough to act on.
That simplicity is one of the strengths of the model, but it also creates one of the main challenges. Because the NASDAQ can produce many possible reactions in one session, the real skill is not finding activity. The real skill is filtering for quality and refusing to overtrade.
Common Mistakes
The biggest mistake in this model is forcing setups that only meet part of the criteria.
A pattern may appear without reaching a proper level. A level may react without producing a clean structure. A trade may look attractive but require more than the standard stop. Those are usually the setups that weaken performance over time.
The strategy works best when everything is aligned. The more pieces that are missing, the more likely the trade becomes a lower-quality attempt rather than a true playbook setup.
Trade Breakdown
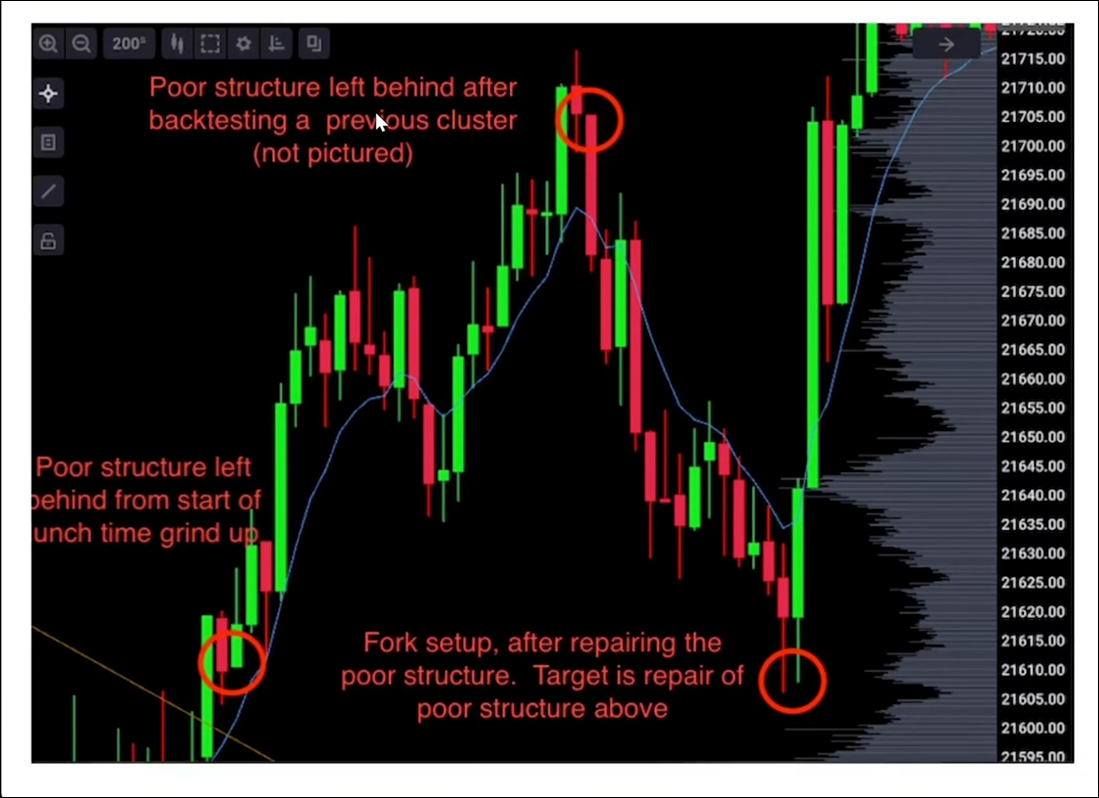
Trade Example 1: Fork Setup
Price is trading above the 620 level, and there is a repair candle above the price that has not been touched yet. This creates a clear magnet, meaning price is likely to move back up into that area.
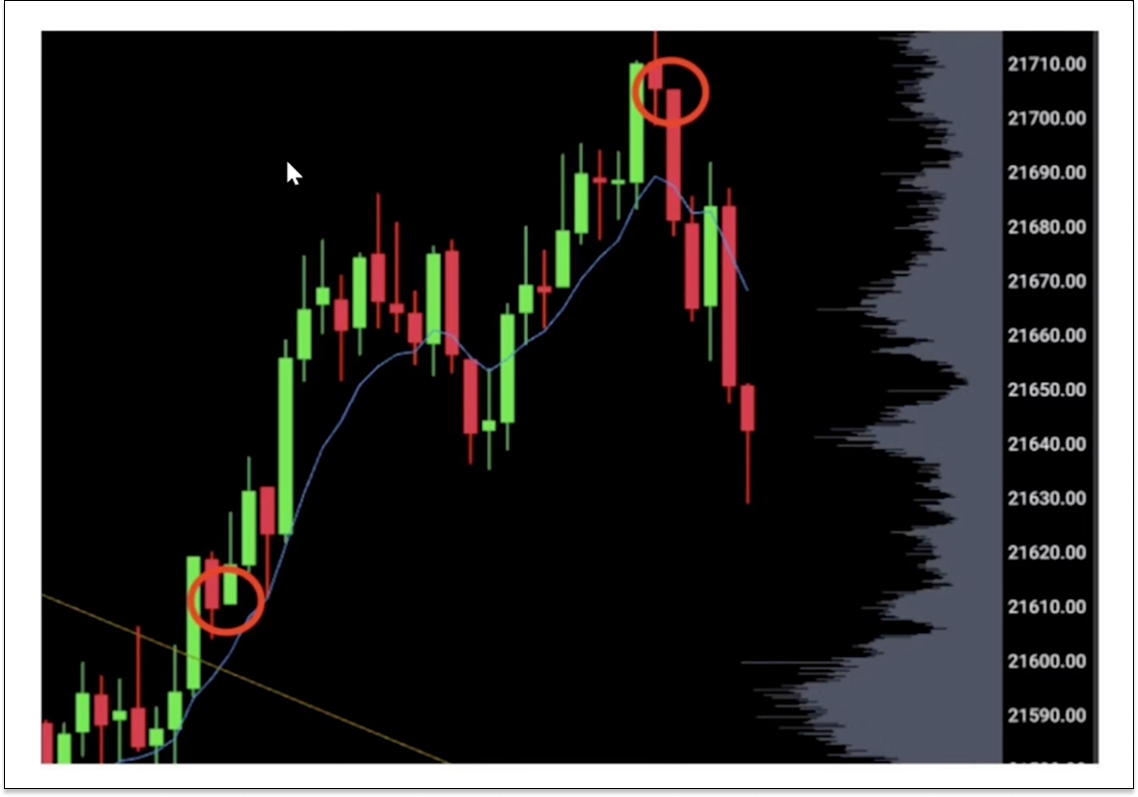
Price then moves down into the 620 level and pushes lower. A candle forms with a long lower wick, showing that sellers pushed the price down, but buyers stepped in and rejected the move.
The next candle tries to go lower again but fails to break the previous low. This confirms that the downside move is no longer continuing and forms the Fork setup.
As soon as the price begins to move back higher from this failed low, a long entry is taken.
The stop loss is placed 10 points below the low, keeping risk tight and controlled.
The first target is +15 points, where part of the position is taken off to cover risk.
After the first target is hit, the stop is moved to break even, removing downside risk from the trade.
From there, the trade is held as price continues higher, with the main objective being the repair above, which acts as a magnet.
Price moves up quickly, pushes through the level, and trades back into the repair, completing the move.
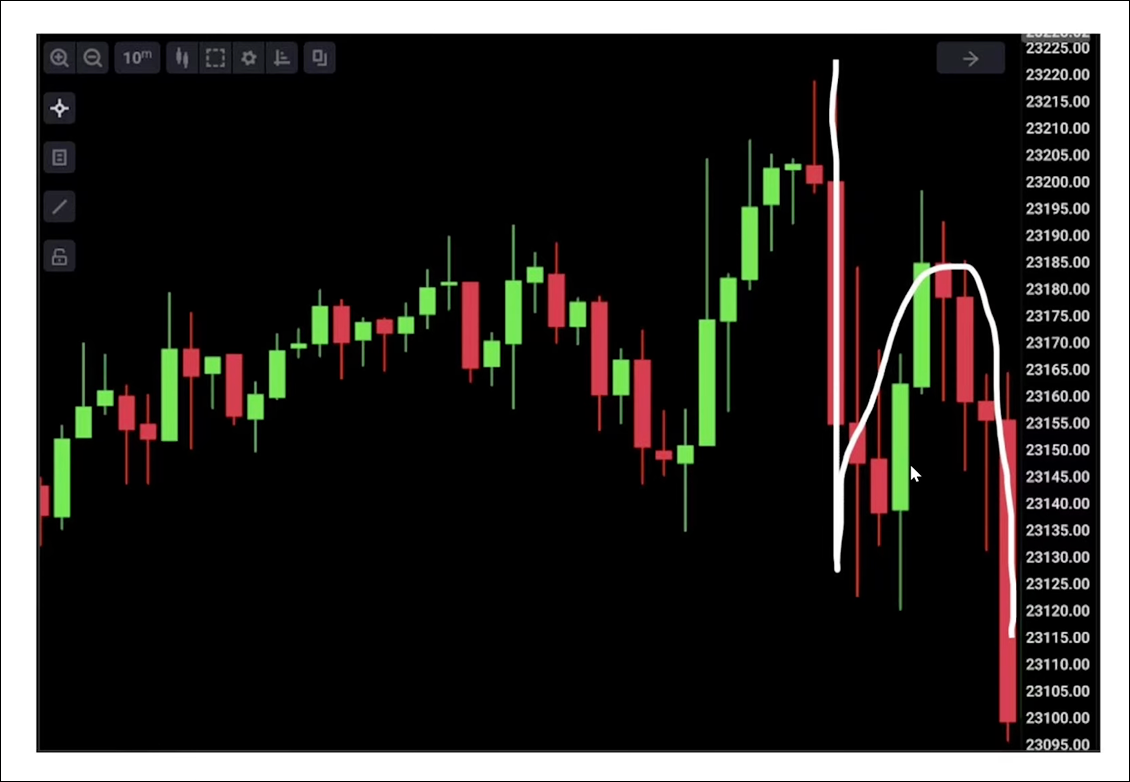
Trade Example 2: H Pattern Setup (Short)
Price makes a strong move down, then begins to bounce.
The bounce pushes the price up into the 80 level, where it forms a candle with a wick into the level, showing rejection.
Instead of continuing higher, the price starts to roll over and forms a lowercase “h” structure, showing that the bounce is weak.
Price then moves lower and comes back to retest the 80 area.
A short entry is taken on this retest of the 80 level, using the level and the structure together.
A 10-point stop is placed above the level.
Price then moves lower, continuing the downside move.
Trade Example 3: Cross-Section Entry (Long)
Price is moving higher, forming two strong candles and creating a clear structure.
Between these two candles, there is a cross-section area, which becomes the key level for entry. This area also aligns with the 20 level, adding confluence.
Price then pulls back into this cross-section zone and tests the level.
As the price touches the area, it shows a reaction and begins to move higher.
A long entry is taken at the cross-section and 20 level. A 10-point stop is placed below the level.
Price reacts immediately, with very little drawdown, and begins moving higher, continuing the move.


.svg)

.svg)