Built For
Instruments: Futures
Trading Style: Scalping/Day Trading
Strategy Overview
The Auction Market Theory & Institutional Order Flow Trading Strategy focuses on understanding how buyers and sellers establish fair value, identifying whether the market is balanced or trending, and using order flow to find trading opportunities.
The strategy is based on Auction Market Theory (AMT), which explains how markets move between areas where buyers and sellers agree on value and areas where one side takes control.
Instead of entering trades based only on candlestick patterns, support and resistance, or technical indicators, the approach combines market structure, Volume Profile, order flow, and fundamental analysis to understand why price is moving.
The strategy focuses on four main components:
- Auction Market Theory: Understand how the market establishes, rejects, and discovers fair value.
- Market Structure: Identify whether the market is balanced or imbalanced using higher-timeframe price action.
- Volume Profile: Locate important price areas where trading activity has been concentrated.
- Order Flow: Identify aggressive buyers and sellers, absorption, and trapped traders to confirm entries.
Fundamental analysis provides additional context by helping explain how economic conditions and institutional expectations influence market direction.
The strategy uses two primary trading models:
Model 1 — Failed Auction: Identify reversals when price moves outside an established value area but fails to sustain the move.
Model 2 — Micro Range Breakout & Trend Continuation: Identify continuation trades when price breaks away from established value, forms a new trading range, and confirms directional strength.
The complete trading process follows this sequence:
Fundamental Analysis → Market Structure → Volume Profile → Trading Setup → Order Flow Confirmation → Entry → Risk Management
Understanding Auction Market Theory
Auction Market Theory explains how financial markets continuously search for prices where buyers and sellers are willing to transact.
Every transaction involves a buyer and a seller, but those participants may have different opinions about what represents a fair price.
When buyers and sellers are comfortable trading within a particular price range, the market establishes an area of value.
When one side becomes more aggressive and the market begins moving away from that range, price searches for a new area where trading activity can develop. This creates two main market conditions: balance and imbalance.
Understanding which condition is developing is the foundation of the strategy because each requires a different trading approach.
Balanced Markets
A balanced market occurs when buyers and sellers continue trading within an established price range. Buyers generally respond near the lower portion of the range, while sellers respond near the upper portion.
As a result, price often rotates between these areas instead of moving consistently in one direction.
Common characteristics include:
- Price repeatedly moving between established highs and lows.
- Breakouts that fail to develop into sustained trends.
- Frequent returns toward the middle of the trading range.
- Overlapping price action and two-sided trading activity.
In this environment, the preferred approach is mean reversion. Rather than expecting every breakout to continue, the trader looks for situations where price attempts to move outside value but fails and returns toward the established range. This creates opportunities for the Failed Auction model.
Imbalanced Markets
An imbalanced market occurs when buyers or sellers establish directional control. Instead of repeatedly returning to the same price range, the market begins moving toward new areas of value.
A bullish imbalance develops when buyers maintain control and continue pushing price higher.
A bearish imbalance develops when sellers maintain control and continue pushing price lower.
Common characteristics include:
- Sustained directional price movements.
- Higher highs and higher lows during bullish conditions.
- Lower highs and lower lows during bearish conditions.
- Breakouts that develop acceptance outside previous value.
- Smaller consolidations followed by continuation.
In this environment, the preferred approach is momentum and trend continuation. Rather than trading against the dominant direction, the trader looks for opportunities to participate in the ongoing move. This creates opportunities for the Micro Range Breakout & Trend Continuation model.
Why Market Conditions Matter
Markets spend substantial time trading within established ranges, while strong directional trends occur less frequently. A trader who attempts to trade every breakout may experience repeated failures when the market is balanced.
Similarly, repeatedly attempting to fade price movements during a strong trend can result in trading against the dominant participants.
The objective is to identify the current market environment before selecting a setup.
Balanced Market → Failed Auction
Imbalanced Market → Micro Range Breakout & Trend Continuation
Identifying Market Structure With One-Time Framing
One-time framing is used to determine whether buyers or sellers are maintaining control of the market.
The analysis begins on higher timeframes, particularly the daily and weekly charts.
Rather than focusing only on individual candlestick patterns, the trader examines how consecutive candles develop relative to one another.
There are three main conditions.
One-Time Framing Up
One-time framing up occurs when consecutive candles establish:
- Higher highs.
- Higher lows.
- Higher closes.
This indicates that buyers are maintaining control and the market is moving directionally higher. Even if price temporarily pulls back, the bullish structure remains intact as long as the sequence continues.
Trading Approach: Prioritize bullish momentum and continuation setups.
One-Time Framing Down
One-time framing down occurs when consecutive candles establish:
- Lower highs.
- Lower lows.
- Lower closes.
This indicates that sellers are maintaining control and the market is moving directionally lower.
Trading Approach: Prioritize bearish momentum and continuation setups.
Balanced Structure
A balanced structure develops when price stops consistently establishing higher or lower highs, lows, and closes. The market may repeatedly move above previous highs or below previous lows without maintaining a directional move. This suggests that neither side has established sustained control.
Trading Approach: Prioritize mean-reversion setups and failed auctions near established value boundaries.
Applying One-Time Framing
Before the trading session, determine:
- Is the market one-time framing higher?
- Is the market one-time framing lower?
- Is price moving within an established range?
- Does the structure favor momentum or mean reversion?
This provides the directional context before moving to lower-timeframe execution.
Understanding Institutional Market Participants
Different market participants operate with different objectives, position sizes, and investment horizons.
Understanding these differences helps explain why markets sometimes trend strongly and other times remain within established ranges.
The framework separates participants into two broad categories.
Day Timeframe Participants (DTF)
Day Timeframe Participants primarily focus on shorter-term market movements.
These may include day traders, intraday algorithms, and short-term trading strategies. Their activity can contribute to short-term volatility, breakouts, and reversals.
Other Timeframe Participants (OTF)
Other Timeframe Participants operate with longer investment horizons.
These may include hedge funds, pension funds, mutual funds, and other institutional investors. Their decisions may be influenced by economic expectations, portfolio allocation, and longer-term investment objectives.
Because these participants can manage substantial capital, their buying and selling activity can influence broader market behavior.
For example, large participants may accumulate positions over time rather than immediately pushing price higher.
This can contribute to prolonged periods of balance. When their positioning or expectations change, the market may begin moving directionally toward a new area of value.
Why Institutional Activity Matters
The objective is not to predict exactly what institutions are doing. Instead, the trader observes how price and volume respond at important levels.
For example:
- Does aggressive selling produce a sustained decline?
- Are buyers absorbing the selling pressure?
- Is price being accepted above previous value?
- Are traders becoming trapped after a failed breakout?
These observations help determine whether the market is likely to continue in its current direction or return toward established value.
Using Volume Profile to Identify Important Levels
Volume Profile shows how much trading activity has occurred at different prices.
Unlike traditional volume indicators, which display volume over time, Volume Profile organizes trading activity by price. This helps identify where buyers and sellers have conducted the most business and where relatively little trading has occurred.
The main levels used in the strategy are:
Point of Control (POC)
The Point of Control is the price where the highest trading volume occurred within the selected profile. It represents an important area of established trading activity.
In balanced markets, price may repeatedly return toward the POC.
For failed-auction trades, it can serve as an intermediate profit target.
Value Area High (VAH)
The Value Area High represents the upper boundary of the profile’s value area. It helps determine whether the market is accepting or rejecting higher prices.
A failed move above VAH can create a bearish mean-reversion opportunity.
Acceptance above previous value can support a bullish continuation scenario.
Value Area Low (VAL)
The Value Area Low represents the lower boundary of the profile’s value area.
A failed move below VAL can create a bullish mean-reversion opportunity.
Acceptance below previous value can support a bearish continuation scenario.
High Volume Nodes (HVNs)
High Volume Nodes are areas where substantial trading activity has occurred. They represent prices where buyers and sellers have previously conducted significant business.
These areas can help identify established value and important consolidation zones.
Low Volume Nodes (LVNs)
Low Volume Nodes are areas where relatively little trading activity has occurred. They often develop where price moves quickly through a particular area.
During directional markets, LVNs can become important locations for pullbacks and continuation opportunities.
However, the trader does not enter simply because price reaches an LVN. Order flow must confirm that buyers or sellers are defending the area.
How Volume Profile Is Used
Volume Profile helps answer three important questions:
- Where has the market established value?
- Is price being accepted or rejected outside that value?
- Where are the important areas for entries, stops, and profit targets?
Once these areas are identified, order flow is used to evaluate the market’s response.
Understanding Order Flow
Order flow provides information about the buying and selling activity behind price movements. It helps determine whether aggressive participants are successfully moving price or whether their orders are being absorbed by the opposing side.
The strategy focuses on four important behaviors.
Aggressive Buying
Aggressive buying occurs when buyers execute orders against available selling liquidity. Strong buying activity can indicate that buyers are attempting to push price higher.
However, aggressive buying alone does not guarantee that price will continue rising. The important question is whether that buying activity produces upward movement.
Aggressive Selling
Aggressive selling occurs when sellers execute orders against available buying liquidity. Strong selling activity can indicate that sellers are attempting to push price lower.
Again, the important question is whether the selling produces the expected decline.
Absorption
Absorption occurs when aggressive orders are met by sufficient opposing liquidity to prevent price from continuing in the expected direction.
For example:
Aggressive sellers repeatedly sell into an important level, but price stops moving lower. This suggests that buyers are absorbing the selling pressure. If buyers subsequently push price higher, the unsuccessful sellers may become trapped. The same concept applies in reverse when sellers absorb aggressive buying.
Trapped Traders
Trapped traders are participants who enter expecting continuation but become positioned against the developing move.
For example:
- Price breaks below an important level.
- Aggressive sellers enter expecting further downside.
- Buyers absorb the selling.
- Price reverses and reclaims the breakdown level.
- Sellers are now positioned against the upward move.
As sellers exit their positions, their buying activity may contribute to the reversal.
This is particularly important in both the Failed Auction and Micro Range Continuation models.
The key principle is: Aggressive activity matters most when combined with the market’s response to that activity.
Trading Models
Model 1 — Failed Auction
Market Condition: Balance
Trading Approach: Mean Reversion
Objective: Identify failed moves outside established value and trade the return into the range.
The Failed Auction model is designed for balanced markets. When the market has established an area of fair value, price may temporarily move beyond its boundaries. However, if buyers or sellers cannot sustain the move, the market may return toward the area where trading activity was previously accepted. The setup focuses on identifying these failed attempts.
There are two variations:
- V-Shaped Failed Auction Reversal.
- Failed Auction With Micro Range Confirmation.
Variation A: V-Shaped Failed Auction Reversal
This variation develops when price moves outside value and quickly reverses. The reversal is typically accompanied by aggressive participation from the opposing side.
Bullish Setup
Step 1: Identify a Balanced Market
Confirm that price is trading within an established value area. Mark the Value Area Low, Point of Control, and Value Area High.
Step 2: Wait for Price to Break Below VAL
Price moves below the Value Area Low. Aggressive sellers enter expecting further downside. The trader does not immediately buy the breakdown.
Step 3: Look for Selling Absorption
Selling pressure begins losing effectiveness. Aggressive sellers continue executing orders, but price struggles to move lower. This suggests buyers may be absorbing the selling.
Step 4: Wait for Price to Reclaim VAL
Aggressive buyers push price back above the Value Area Low. The reversal indicates that the attempted breakdown has failed. Sellers who entered below value may now be trapped.
Step 5: Enter Long
Enter when price reclaims VAL with convincing aggressive buying. This variation uses a faster entry because the reversal develops quickly.
Step 6: Place the Stop-Loss
Place the protective stop below the area defended by aggressive buyers. The trade becomes invalid if buyers lose control of that area.
Step 7: Manage the Trade
The first important objective is the Point of Control. At the POC, consider taking partial profits or reducing risk. The broader target is the opposite side of the value area, near VAH.
Bearish Setup
The bearish version follows the opposite sequence.
- Confirm a balanced market.
- Wait for price to break above VAH.
- Observe aggressive buying above value.
- Look for buying absorption.
- Wait for aggressive sellers to push price back below VAH.
- Enter short after the bearish reclaim.
- Place the stop above the area defended by sellers.
- Use the POC as an intermediate target and VAL as the broader objective.
Setup Sequence:
Break Outside Value → Absorption → Aggressive Reversal → Reclaim Value → Entry → Rotation Toward POC
Variation B: Failed Auction With Micro Range Confirmation
This variation develops when price attempts to establish value outside the previous range but eventually fails. Unlike the V-shaped reversal, the rejection is not immediate.
Price may spend time consolidating outside value before returning to the previous range. The trader then waits for a smaller range to develop and uses that structure to confirm the entry.
Bearish Setup
Step 1: Identify a Balanced Market
Mark the established value area and its upper and lower boundaries.
Step 2: Wait for Price to Move Above VAH
Price breaks above the Value Area High. Instead of immediately reversing, the market begins consolidating at higher prices. This suggests that buyers are attempting to establish a new area of value.
Step 3: Wait for the Attempt to Fail
The market cannot sustain the higher prices. Price moves back below VAH and returns into the previous value area.
Step 4: Identify the Micro Range
After returning into value, price begins consolidating below VAH. This smaller range provides a clearer area for evaluating whether sellers are taking control.
Step 5: Look for an Entry
There are two possible entries.
Plan A — Sell the Top of the Micro Range
Price moves toward the upper boundary of the micro range. Aggressive sellers defend the area and prevent price from moving higher. Enter short when selling activity confirms the rejection.
Plan B — Sell the Micro Range Breakdown
Price breaks below the micro range with aggressive selling. Enter short when the breakdown confirms that sellers are taking control.
Step 6: Place the Stop-Loss
Use the area defended by sellers and the relevant range structure to determine where the trade becomes invalid.
Step 7: Manage the Trade
The objective is a rotation through the established value area. The POC provides an intermediate target, while VAL represents the broader rotation objective.
Bullish Setup
The bullish variation follows the opposite sequence.
- Price attempts to establish value below VAL.
- The market fails to sustain the move lower.
- Price returns above VAL.
- A micro range develops inside the previous value area.
- Buyers defend the lower portion of the range, or aggressive buying breaks above it.
- Enter long after confirmation.
- Place the stop below the relevant invalidation area.
- Target the POC and potentially VAH.
Difference Between the Two Variations
The V-shaped reversal develops quickly and relies on aggressive buying or selling to reclaim value.
The micro range variation develops more slowly and requires the market to demonstrate acceptance back inside value before confirming the next move.
Both approaches trade failed attempts to move away from established value.
Model 2 — Micro Range Breakout & Trend Continuation
Market Condition: Imbalance
Trading Approach: Momentum / Trend Continuation
Objective: Participate in directional moves after price establishes acceptance outside previous value.
The Micro Range Breakout & Trend Continuation model is designed for markets where buyers or sellers have established directional control.
Instead of looking for price to return toward the previous value area, the trader looks for evidence that the market is accepting new prices.
A breakout alone is not enough. The preferred approach is to wait for price to move away from established value and form a smaller consolidation range. This is called a micro range.
Understanding the Micro Range
A micro range develops when price breaks away from a previous trading range and begins consolidating at new prices.
For example, during a bullish trend:
- Price breaks above an established range.
- Buyers maintain control instead of allowing a complete reversal.
- Price begins consolidating above the previous range.
- The consolidation creates a new area where trading activity is accepted.
- The trader looks for the next move higher.
The micro range provides clear boundaries for identifying entries and invalidation levels.
There are two primary entry approaches.
Bullish Continuation Setup
Step 1: Confirm Bullish Market Conditions
The higher-timeframe structure should favor upward continuation. One-time framing up provides supporting evidence that buyers are maintaining control.
Step 2: Identify the Breakout
Price moves above an established range or value area. Avoid automatically buying the initial breakout. Wait to see whether price can sustain the move.
Step 3: Wait for a Micro Range
Price begins consolidating above the previous range. This indicates that the market is attempting to establish value at higher prices.
Step 4: Look for the Entry
Two entry plans can develop.
Plan A — Seller Trap and Reclaim
Price attempts to break below the micro range. Aggressive sellers enter expecting the market to move lower. However, buyers absorb the selling pressure.
Price reverses and reclaims the lower boundary of the micro range. The sellers who entered on the breakdown may now be trapped.
Entry: Buy when price reclaims the lower boundary with aggressive buying confirmation.
Stop-Loss: Place the protective stop below the area defended by buyers.
This approach provides an opportunity to enter near the lower portion of the newly established value area.
Plan B — Aggressive Breakout
Sometimes the market does not create a seller trap. Instead, price remains within the micro range before breaking higher. The trader waits for aggressive buying to push price above the upper boundary.
Entry: Buy when aggressive buying confirms the breakout above the micro range.
Stop-Loss: Place the stop using the relevant defended level and market structure.
This entry is different from buying the original breakout.
The market has already moved away from previous value and established a new consolidation area before the continuation entry.
Bearish Continuation Setup
The bearish setup follows the opposite sequence.
Step 1: Confirm bearish market conditions and one-time framing down.
Step 2: Wait for price to break below established value.
Step 3: Allow a micro range to form at lower prices.
Step 4: Look for one of two entries.
Plan A — Buyer Trap and Reclaim
Price attempts to break above the micro range. Aggressive buyers enter, but sellers absorb the buying.
Price reverses below the range boundary. Enter short after the bearish reclaim confirms that buyers are trapped.
Plan B — Aggressive Breakdown
Price breaks below the micro range with aggressive selling. Enter short when the breakdown confirms continuation.
Step 5: Place the stop above the relevant invalidation area.
Step 6: Manage the position as price continues establishing value at lower levels.
Continuation Through Multiple Micro Ranges
During strong directional conditions, price may repeatedly establish new areas of value.
A bullish market may:
- Break higher.
- Form a micro range.
- Continue higher.
- Form another micro range.
- Continue toward the next price area.
Each new micro range can create another opportunity to participate in the trend.
The objective is not to enter every consolidation.
The trader waits for market structure and order flow to support the next directional move.
Using Low Volume Nodes for Trend Continuation
Low Volume Nodes can provide additional trading locations during imbalanced markets. When price moves quickly through an area, relatively little trading activity may occur there. These areas appear as low-volume sections of the Volume Profile.
During a strong trend, price may return toward an LVN before continuing in the original direction.
Bullish LVN Continuation
Step 1: Confirm the Uptrend
The market should be demonstrating bullish directional control.
Step 2: Identify the LVN
Locate a Low Volume Node beneath the newly established area of value.
Step 3: Wait for the Pullback
Price returns toward the LVN.
Do not immediately enter long simply because the level has been reached.
Step 4: Observe Order Flow
Look for aggressive selling to lose effectiveness.
Buyers should begin absorbing the selling pressure.
Step 5: Confirm the Buying Response
Aggressive buyers defend the area and begin pushing price higher.
Step 6: Enter Long
Enter after the buying response confirms the continuation setup.
Step 7: Place the Stop-Loss
Place the stop below the area defended by buyers.
Step 8: Manage the Continuation
The objective is for price to resume moving higher as buyers maintain control.
Bearish LVN Continuation
The same approach applies in reverse.
- Confirm bearish market conditions.
- Identify an LVN above the current trading area.
- Wait for price to pull back toward the level.
- Look for buying absorption and selling pressure.
- Enter short after sellers confirm control.
- Place the stop above the relevant invalidation area.
- Manage the trade in the direction of the downtrend.
An LVN provides a potential trading location, not an automatic entry signal. Order flow must support the expected response.
Fundamental Analysis and Market Direction
Fundamental analysis helps explain the broader forces influencing market behavior.
Large market participants often make decisions based on economic expectations, interest rates, inflation, and changes in financial conditions.
These factors can influence whether institutions are interested in accumulating positions, reducing exposure, or maintaining existing investments.
Interest Rates
Interest rates influence the cost of capital and the relative attractiveness of different investments.
Changes in expectations about monetary policy can affect market direction.
For example, expectations of lower interest rates may support certain risk assets, while expectations of higher rates can place pressure on valuations.
However, the market’s response depends on the broader economic environment.
Inflation and Economic Data
Important economic releases can influence institutional expectations and market positioning.
Relevant information includes:
- Inflation reports.
- Central bank decisions.
- Interest-rate expectations.
- Employment data.
- Economic growth indicators.
- Company earnings and other market catalysts.
Market Expectations vs. Actual Results
Markets respond not only to economic data but also to how that information compares with expectations.
An apparently positive announcement does not always produce a sustained rally.
If buyers cannot maintain control after favorable information, the price response may indicate weakness.
Similarly, a market that refuses to decline after negative information may be demonstrating underlying strength.
The objective is to understand the fundamental environment while allowing price action to confirm the actual market response.
Building the Trading Plan
Market preparation begins before looking for an entry. The goal is to identify important price areas, understand the current market environment, and prepare possible scenarios.
Review Higher-Timeframe Structure
Begin with the weekly and daily charts.
Determine whether the market is:
- One-time framing up.
- One-time framing down.
- Balanced.
This establishes the broader directional context.
Review the Fundamental Environment
Identify important economic releases and relevant catalysts.
Consider how current expectations may influence market direction.
Analyze Volume Profile
Use relevant Volume Profiles to identify:
- Value Area High.
- Value Area Low.
- Point of Control.
- High Volume Nodes.
- Low Volume Nodes.
These levels help establish potential areas of interest.
Identify Trading Scenarios
Prepare for different market outcomes.
Bullish Scenario: Buyers defend an important area, absorb selling pressure, and reclaim a level.
Bearish Scenario: Sellers defend an important area, absorb buying pressure, and push price lower.
Balanced Scenario: Price continues rotating within established value, creating potential failed-auction opportunities.
Continuation Scenario: Price establishes acceptance outside previous value and forms a micro range.
Wait for Confirmation
The trading plan identifies where an opportunity may develop. Order flow determines whether the expected behavior is actually occurring.
The trader should not enter solely because price reaches a previously marked level. The market must confirm the setup.
Risk Management and Trade Execution
Risk management is based on defining the trading setup, identifying where the idea becomes invalid, and controlling the amount of capital exposed.
Define the Trade Before Entering
Every trade should have:
- A clear market condition.
- A specific trading model.
- An entry trigger.
- A protective stop.
- A logical profit objective.
The setup determines how the trade should be managed.
Place Stops Based on Market Structure
Stops should be placed at levels that invalidate the original trade idea.
- For bullish setups, the stop is generally placed below the relevant area defended by buyers.
- For bearish setups, the stop is generally placed above the relevant area defended by sellers.
The objective is to protect the position if the expected buying or selling response fails.
Manage Failed Auctions Through Value
For failed-auction trades, the Point of Control provides an important intermediate objective. The opposite value-area boundary represents the broader rotation target.
As price approaches these areas, the trader can consider reducing exposure, taking partial profits, or protecting the remaining position.
Manage Continuation Trades With Market Structure
For continuation setups, trade management depends on whether price continues establishing value in the expected direction.
If the market fails to sustain the move or the expected order-flow support disappears, the original thesis should be reassessed.
Divide Risk Between Entry Plans
When both Plan A and Plan B are available, the trader may divide the planned risk between them.
For example, part of the risk can be allocated to a trapped-trader entry and the remainder to a confirmed breakout.
The combined risk should remain within the original risk budget.
Adjust to Market Conditions
Not every session provides clear trading opportunities.
When the market is uncertain, the trader can reduce position size, become more selective, or avoid forcing trades.
A valid setup may also fail to produce the expected follow-through.
When that happens, protecting capital is more important than remaining committed to the original expectation.
The Complete Trading Process
The strategy follows a consistent decision-making process.
1. Establish the Fundamental Context
Review economic conditions, important announcements, and market expectations.
2. Identify the Market Regime
Use higher-timeframe structure to determine whether the market is balanced or imbalanced.
3. Mark Important Price Levels
Use Volume Profile to identify value boundaries, the POC, and significant volume nodes.
4. Select the Trading Model
In balanced markets, look for failed auctions.
In imbalanced markets, look for micro range continuation setups.
5. Wait for Price to Reach the Trading Area
Allow the market to approach an important level rather than entering randomly.
6. Confirm With Order Flow
Look for absorption, aggressive buying or selling, trapped traders, or acceptance outside value.
7. Execute the Entry
Use the entry approach that matches the confirmed setup.
8. Define the Stop-Loss
Protect the trade beyond the level that invalidates the original thesis.
9. Manage the Position
Use established value levels, market structure, and order-flow behavior to guide exits.
10. Reassess When Conditions Change
If the market no longer supports the original setup, adjust the position or exit.
 NinjaTrader
Test this strategy on NinjaTrader before you risk a dollar
14 days free simulated trading trial. Practice your edge without risking your capital.
Live Trade Breakdown
Trade 1: Seller Trap Reversal
- Instrument: ES futures
- Trade direction: Long
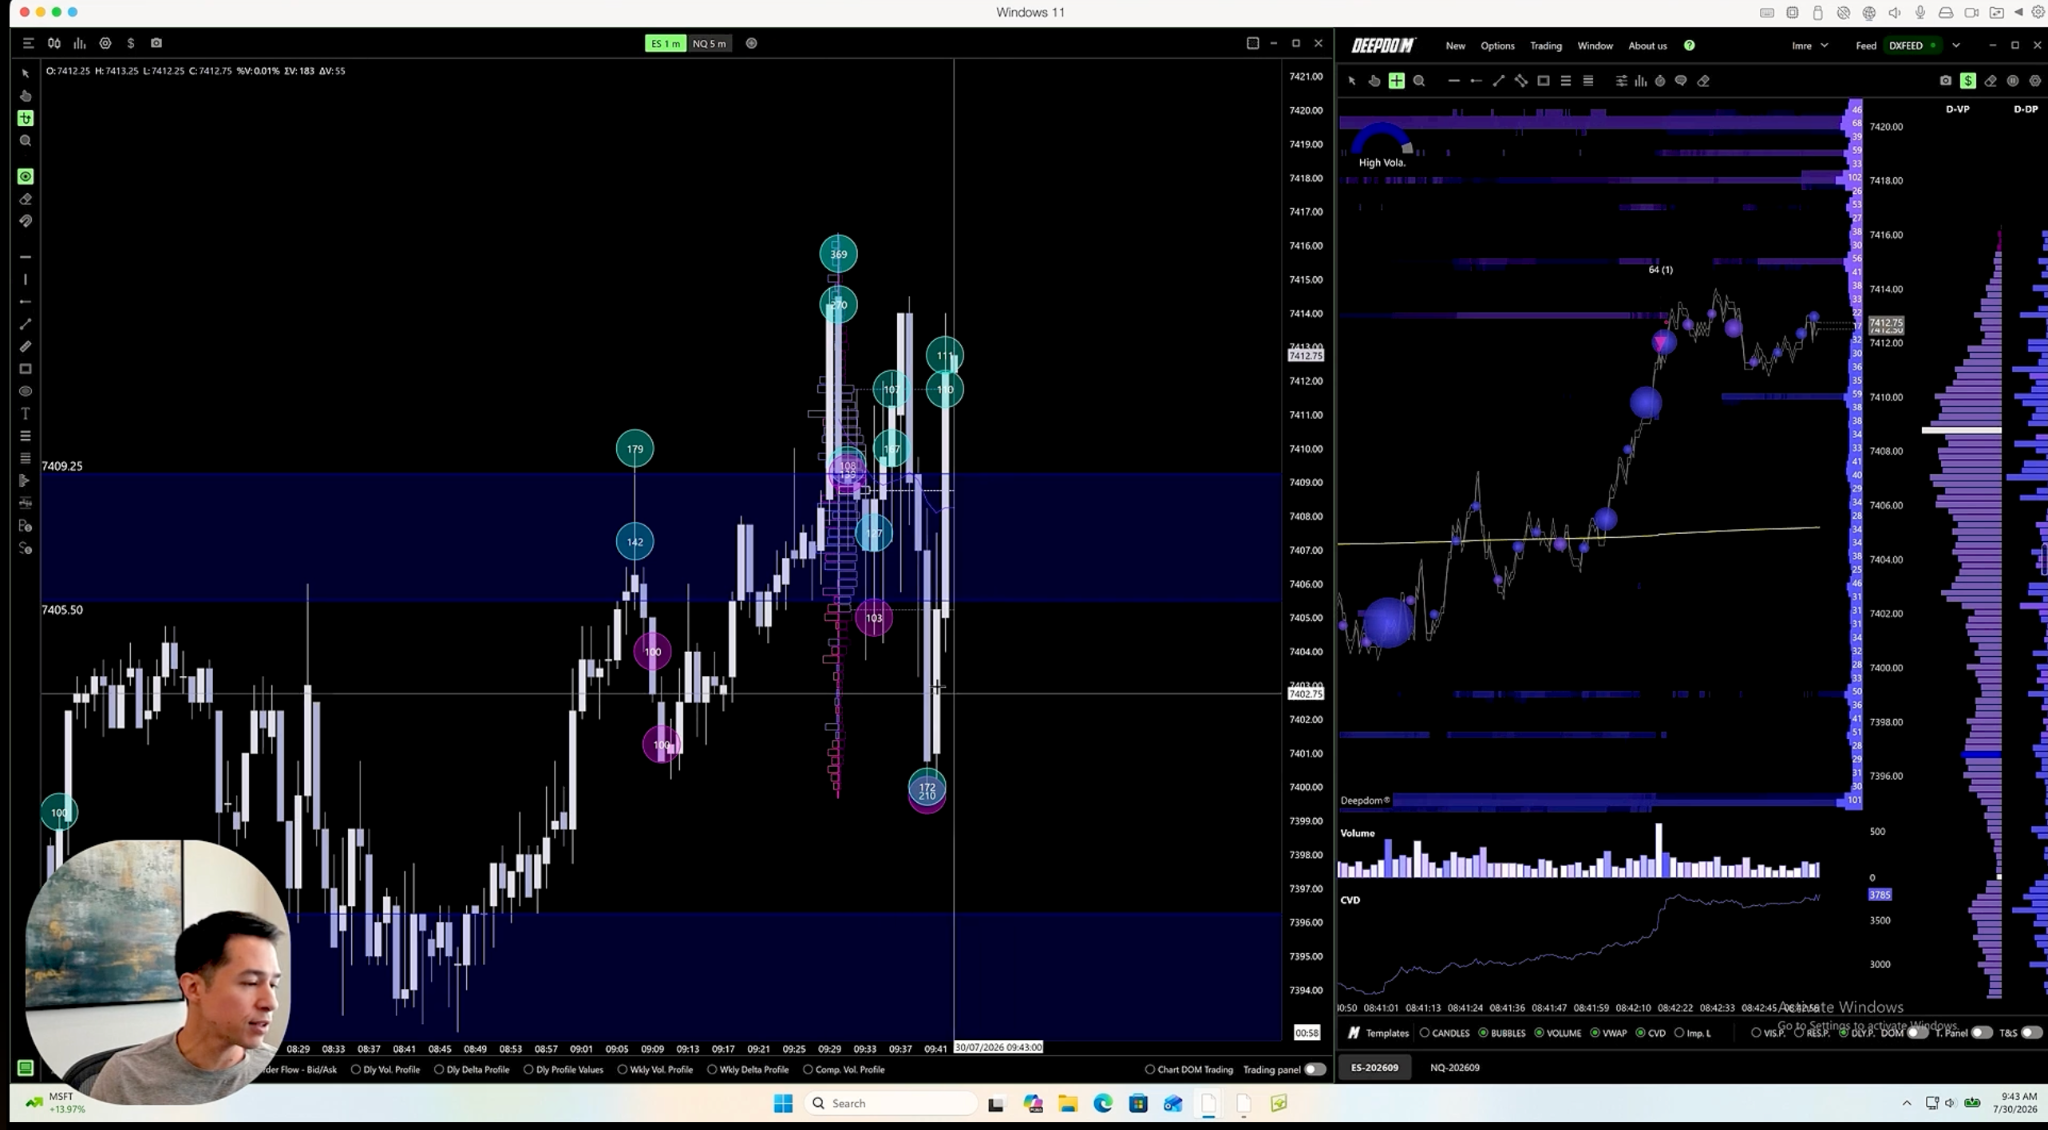
- Setup: Selling absorption and seller trap at the upper control zone (7405 to 7409)
- Position size: Two ES mini contracts
Step 1: The open
A few minutes into the session, buyers and sellers are fighting at the control zone. Big buyers between 7410 and 7416 are not being rewarded for their aggression, and 7405 is acting as a relative discount for the session. The opening range is value building, the chop zone, so no trade is taken yet. Price then starts moving lower, back into the area of the earlier trap.
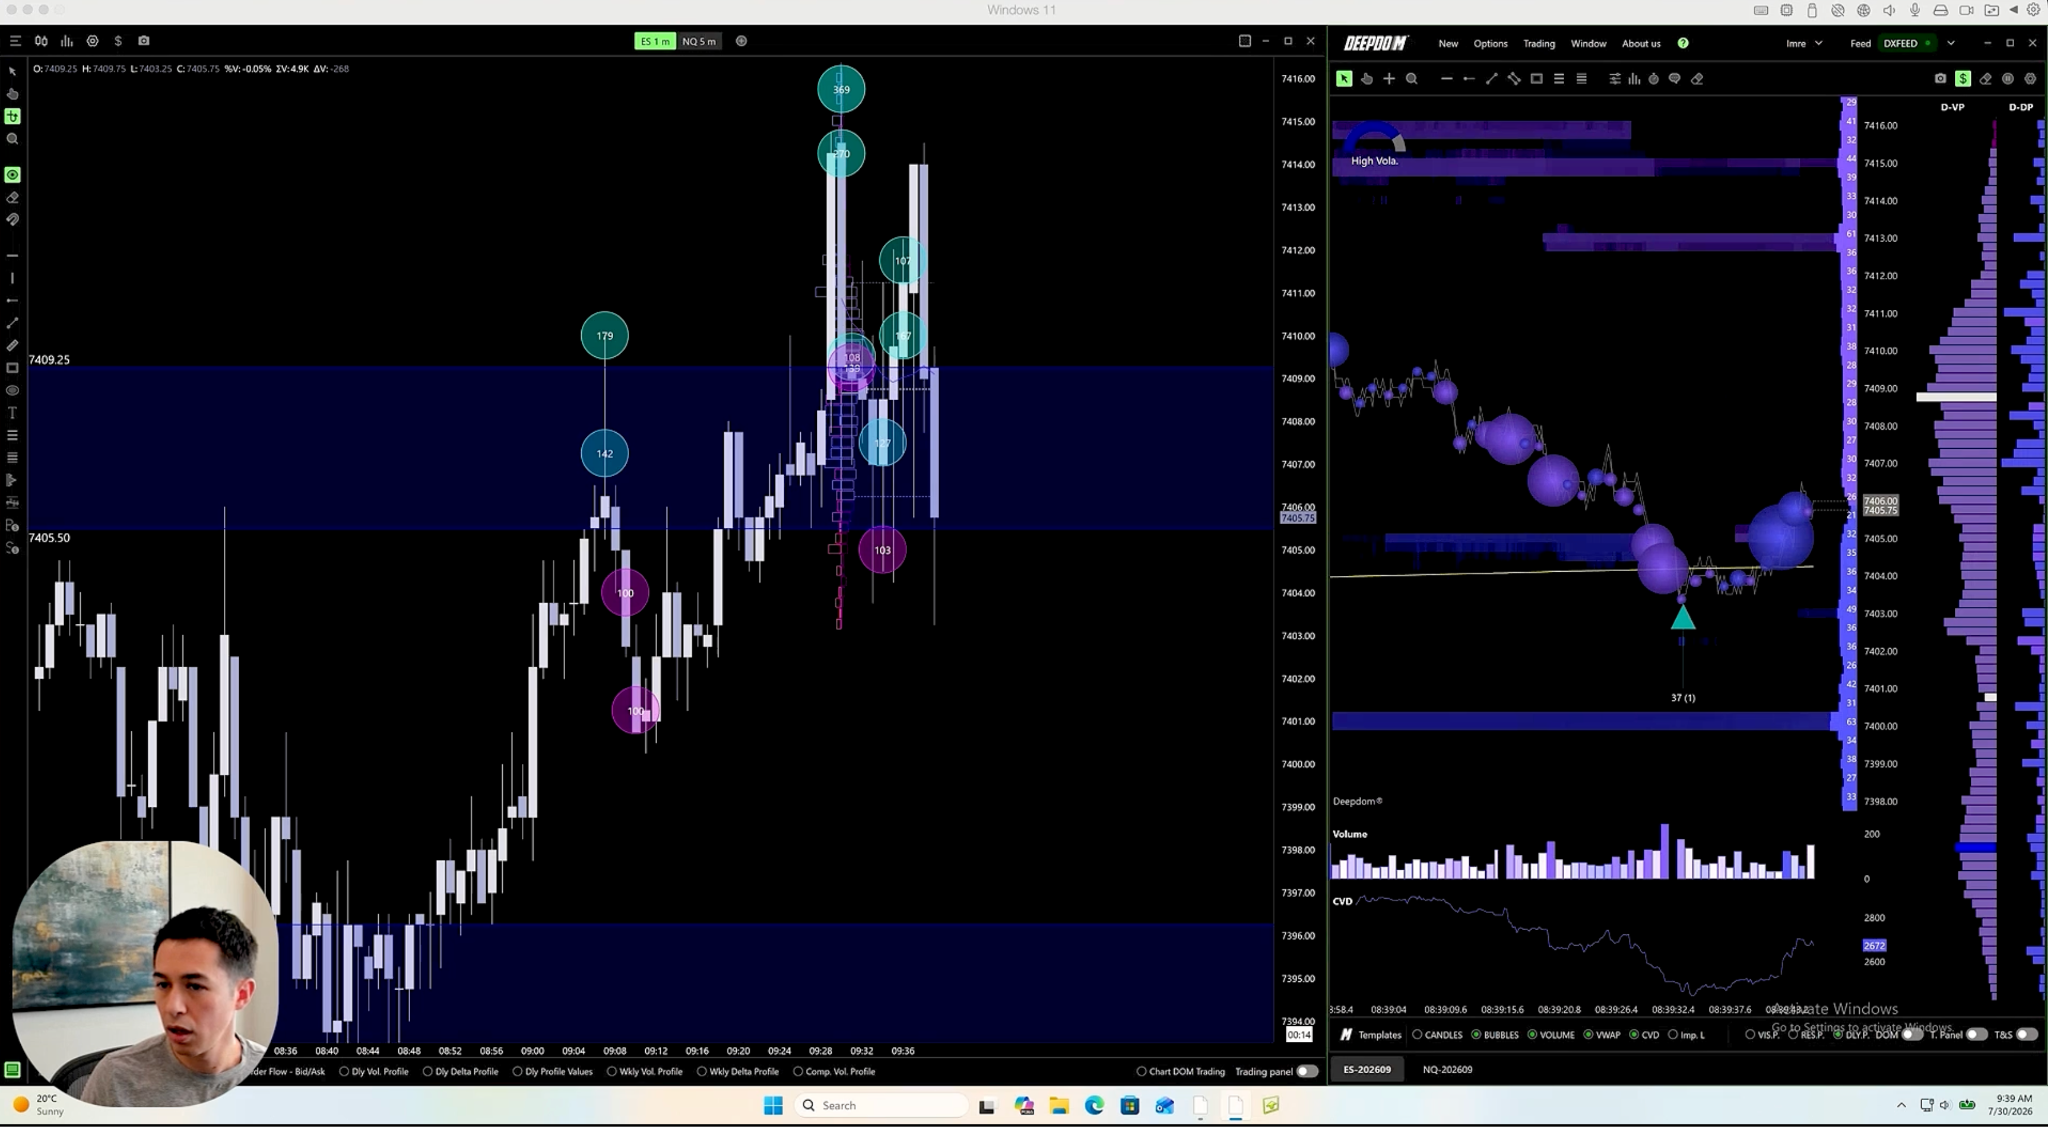
Step 2: Watch for absorption
He switches to Deep DOM to look for absorption, planning to build a small long position if it appears. At first the absorption doesn’t show, so the trade isn’t taken yet.
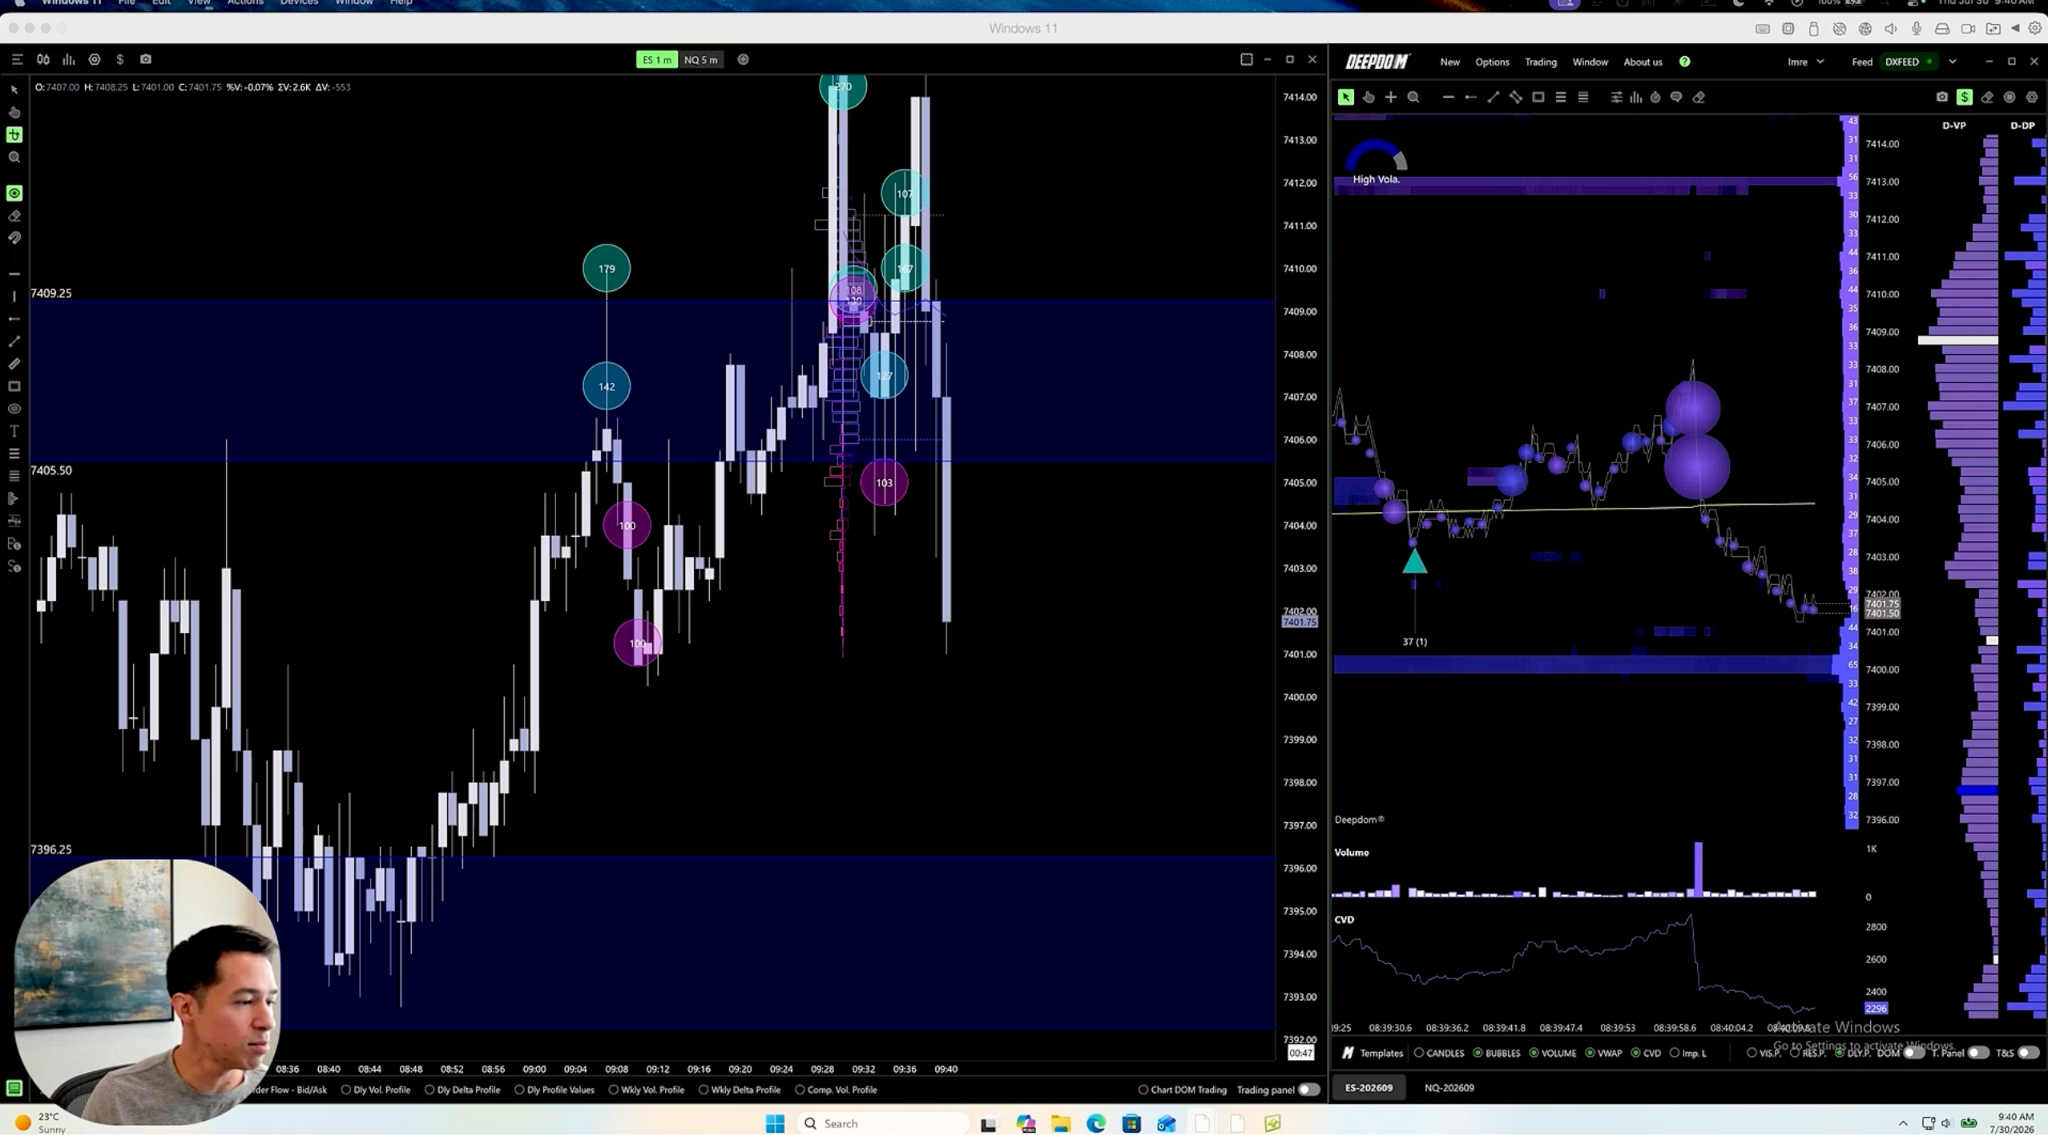
Step 3: Seller pressure at 7405 to 7407
A buyer response starts. He points out seller deltas at 7407 and 7405 on Deep DOM. Getting back above them would trap those sellers. The selling flow is still strong, and buyers can’t break higher yet.
Step 4: Why there’s no short
He says a reclaim of 7405 would make him a buyer. He doesn’t short the drop because the move was too fast and the risk of absorption was too high, since that was where buyers had stepped in before.
Step 5: Waiting for the reclaim
Sellers push once more. He waits for a clean reclaim of 7405, saying buyers have to get above 05. Price starts moving up on light flow, then the buying improves.
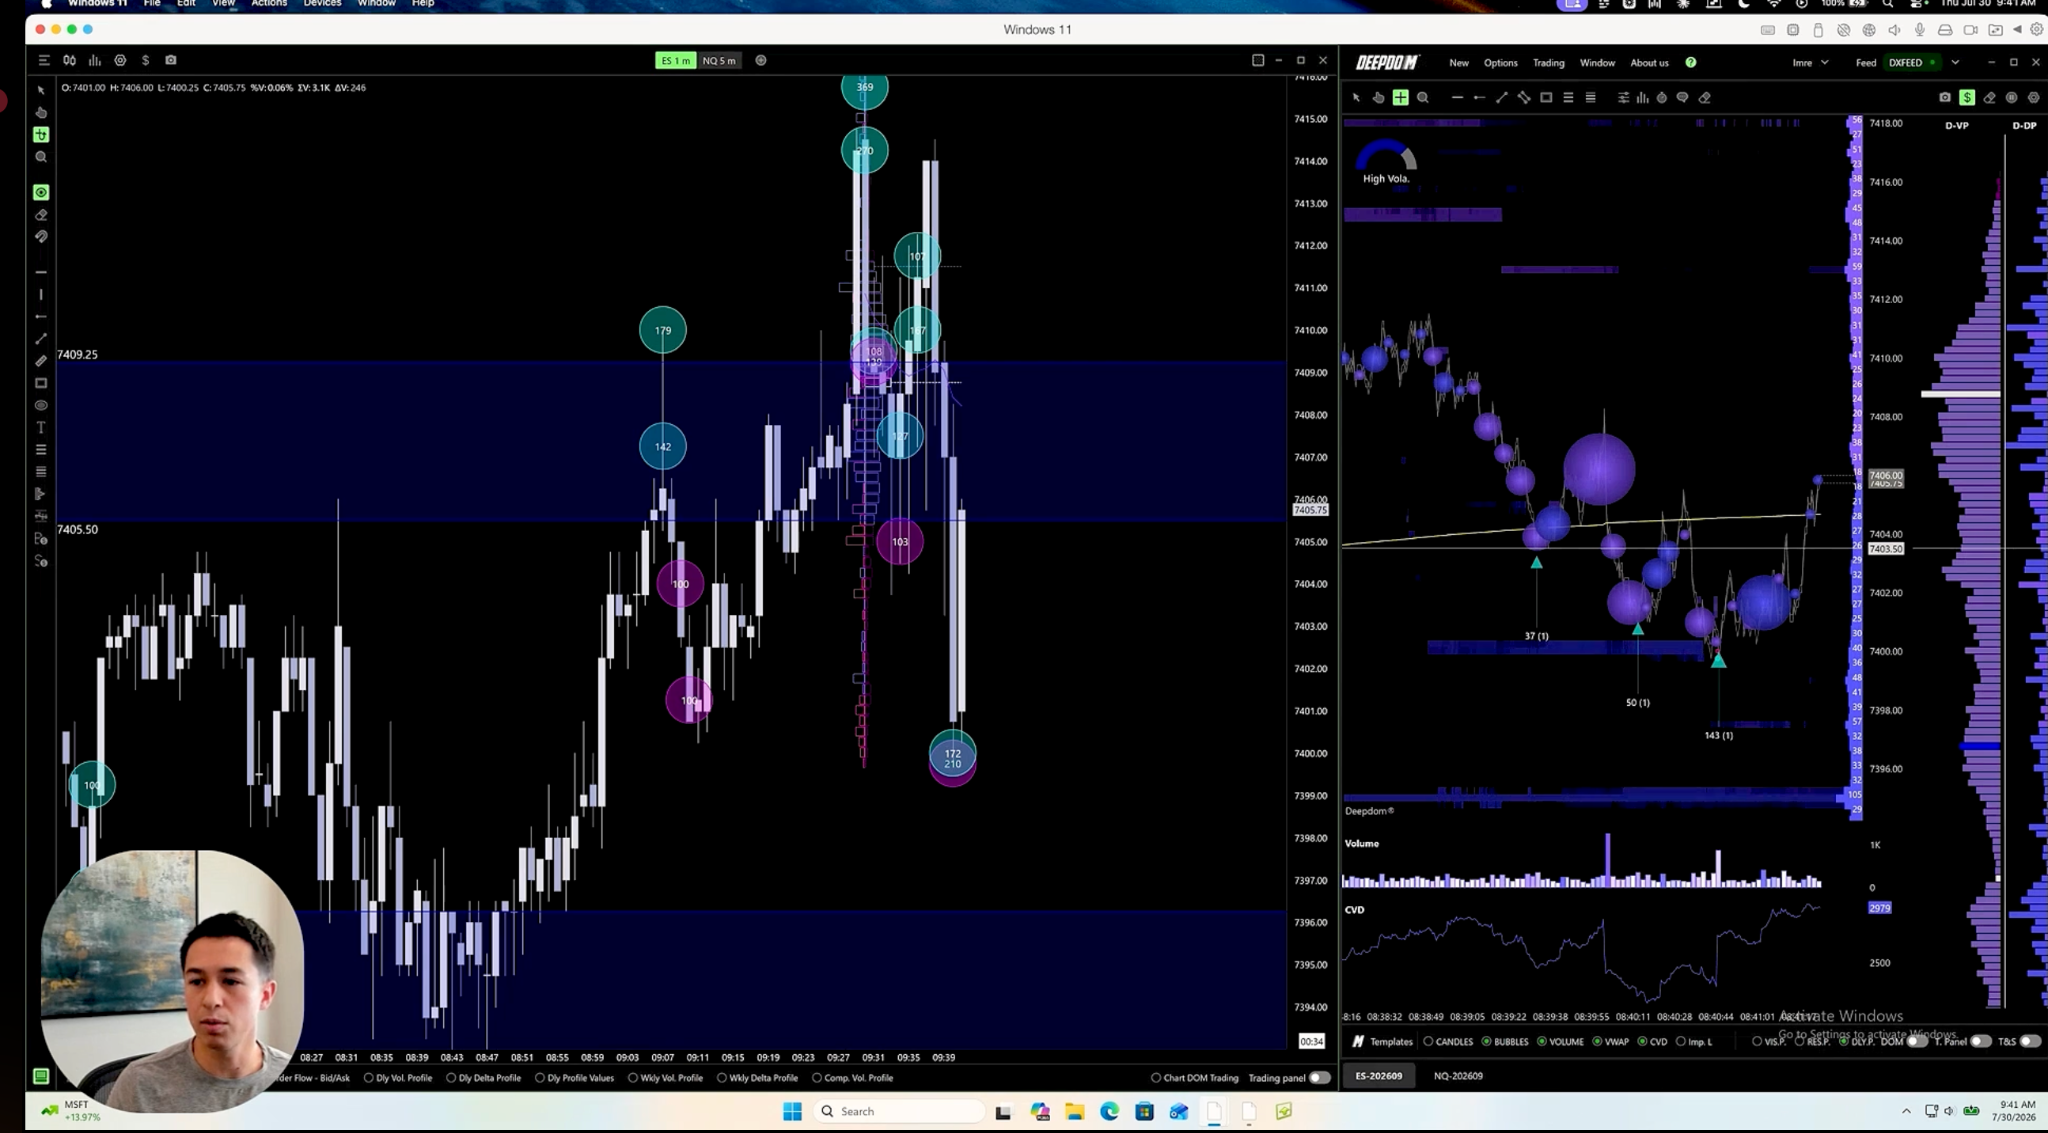
Step 6: Entry and exit
- Entry: filled long at about 7405.25 on the reclaim of 7405, with two mini contracts. He pulls up the trade on screen at this point.
- Exit: covered at 7412, back at the prior highs.
Step 7: Why it worked and why he exited
The trade was based on sellers trying to push lower and getting absorbed. Sellers had been aggressive at 7405, so a reclaim of that level showed strength from buyers and trapped the selling flow. He exited at the prior highs because sellers had been very willing to get involved there. Holding on in hope made no sense unless price broke above and started trading sideways, which would be the reason to get back in.
Trade 2: Micro Range Breakout and Retest
- Instrument: ES futures
- Trade direction: Long
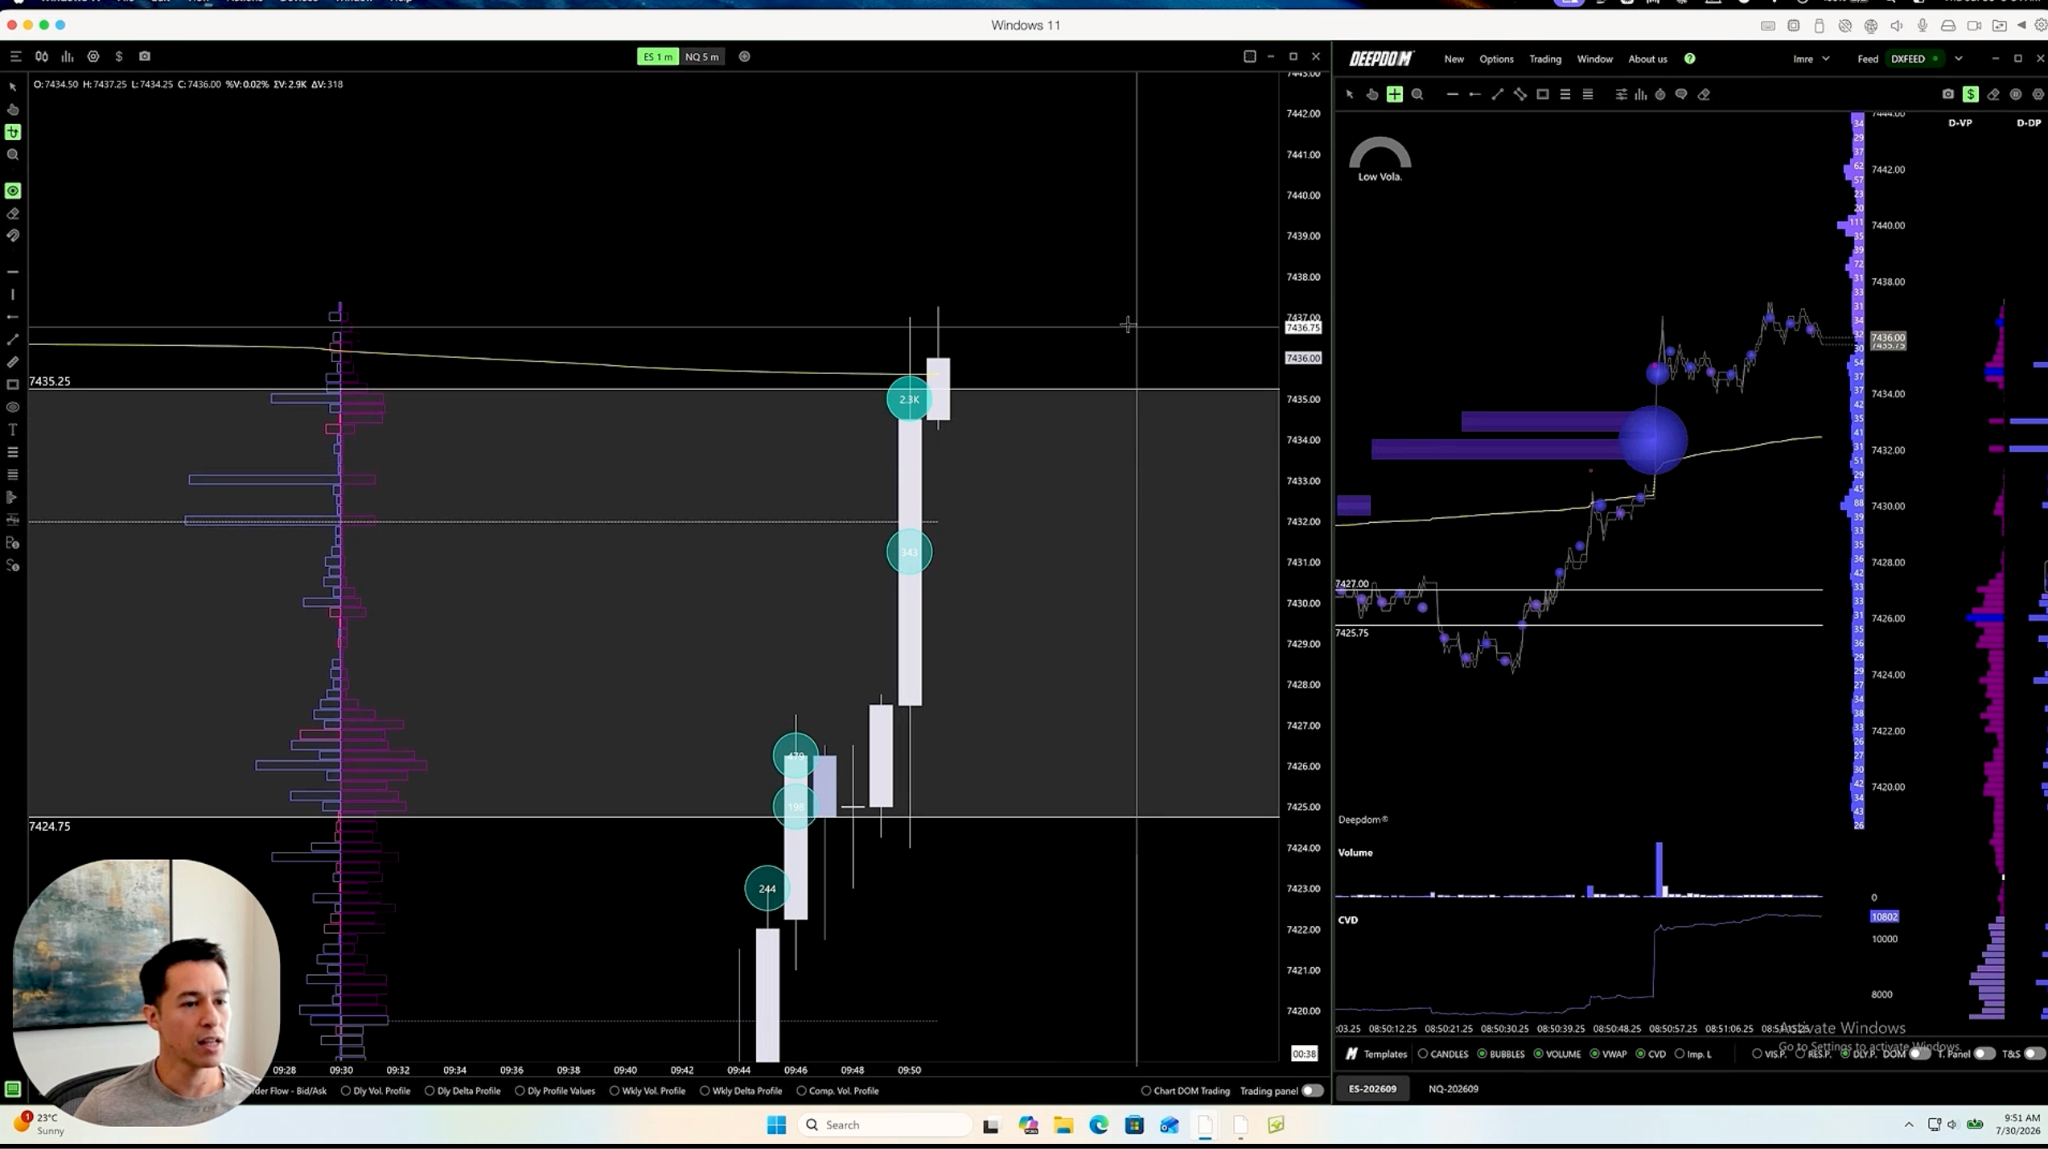
Step 1: Don’t chase the first push (2:01:44 to 2:02:19)
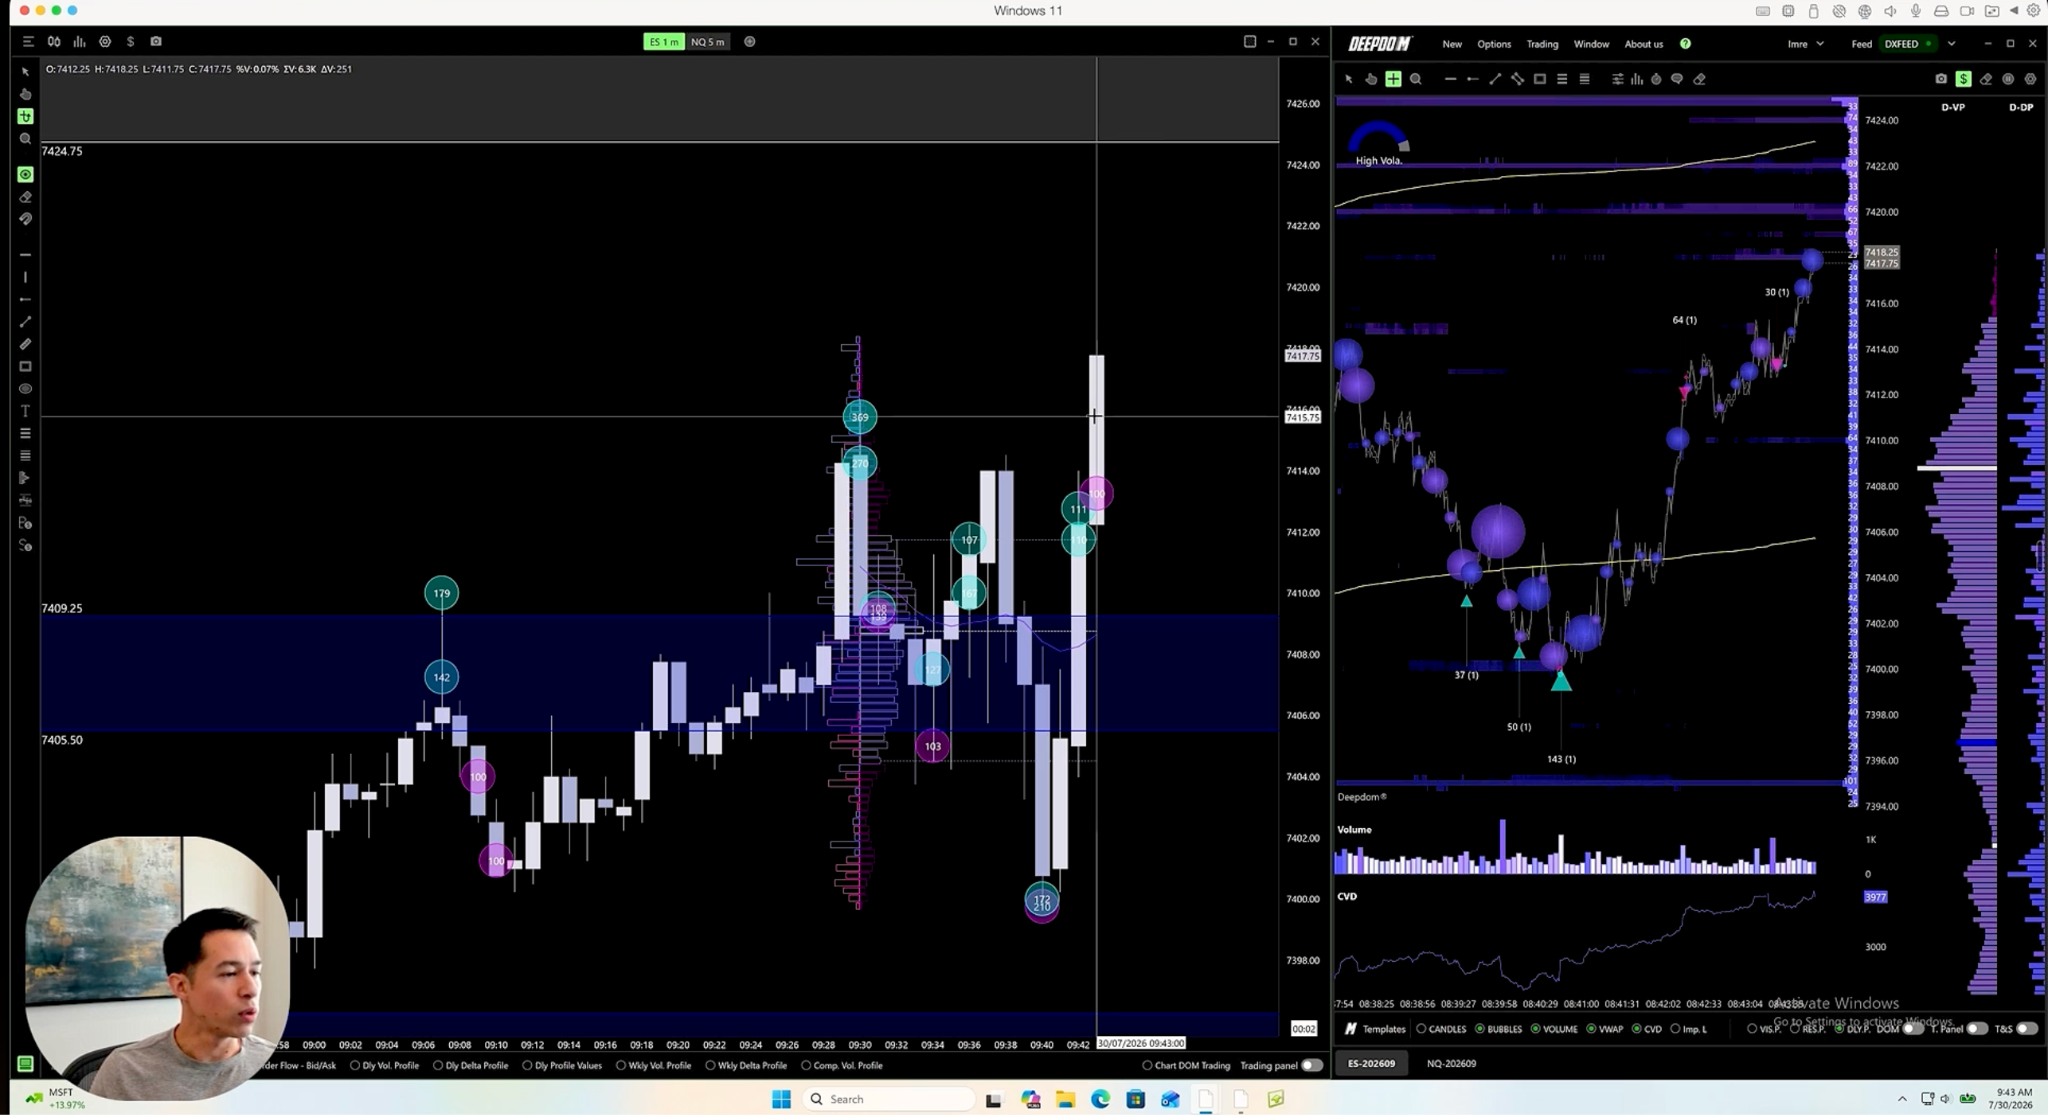
Price breaks higher, but he says this is only price moving, not value being built. Price could run straight to the next zone. Even so, he would rather see a pullback to where the earlier delta was than chase the move.
Step 2: The micro range builds (2:02:21 to 2:03:49)
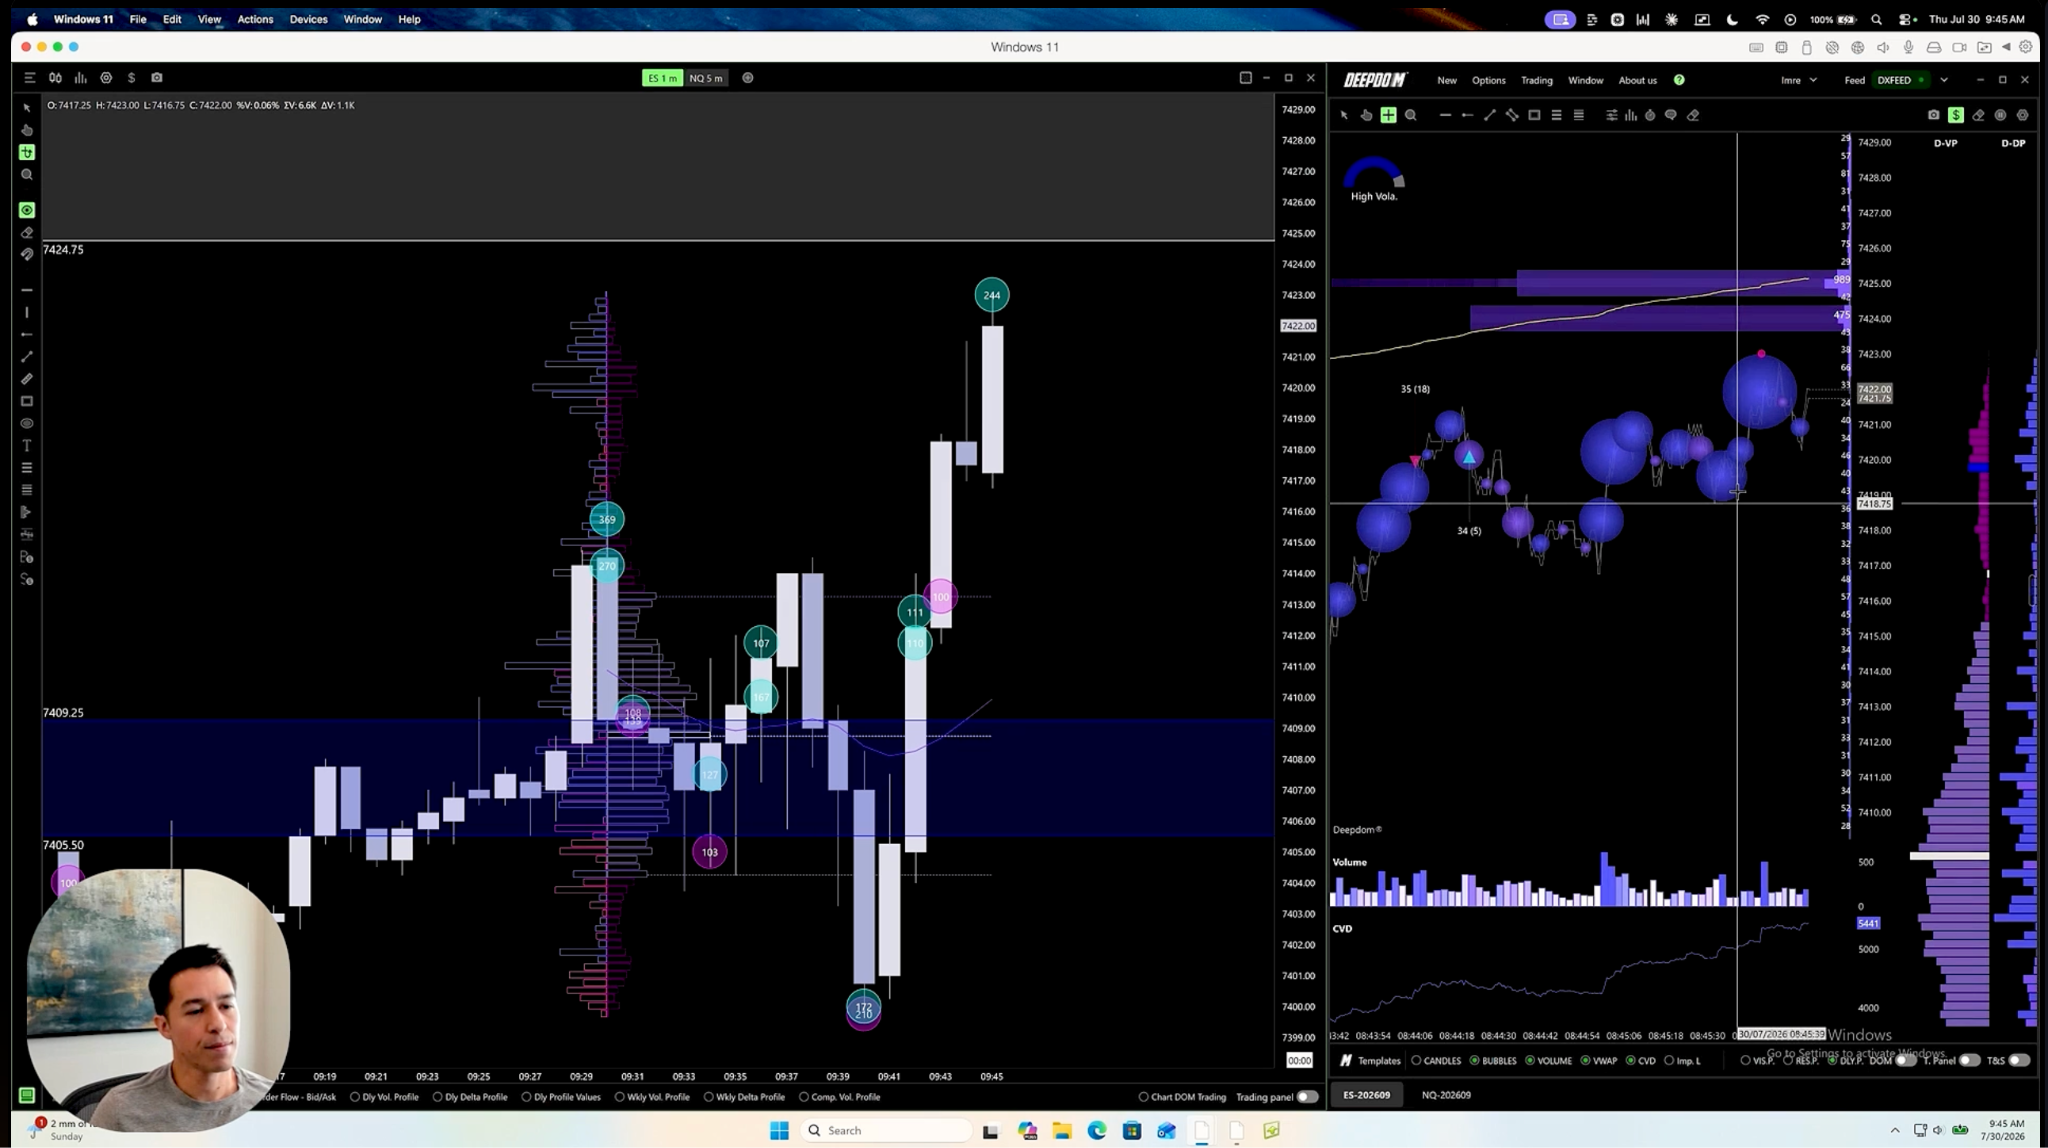
A micro range starts forming on the heatmap. There is a clear area where buyers were absorbed for the moment. He wants one more poke lower before a breakout. He notes a large delta of 244 at the top of the range.
Step 3: Sellers pull their orders
Big sellers are sitting at 7424 and 7425. The seller at 7425 pulls their order, then the roughly 500 contracts at 7424 are pulled too. A big seller at 7428 also disappears as price comes into the upper zone.
Step 4: Confirm the level on the weekly profile
On the weekly volume profile, 7424 to 7435 is the first high volume node of the larger distribution. It holds nearly as much volume as the POC area, which shows the market has done a lot of business there before.
Step 5: Don’t front-run the breakout
There are big buyers absorbed below and a big seller showing at 7434. The rule here is never to front-run a breakout unless it comes from value. A big order at 7430 is not a reason to get in early.
Step 6: The breakout and retest
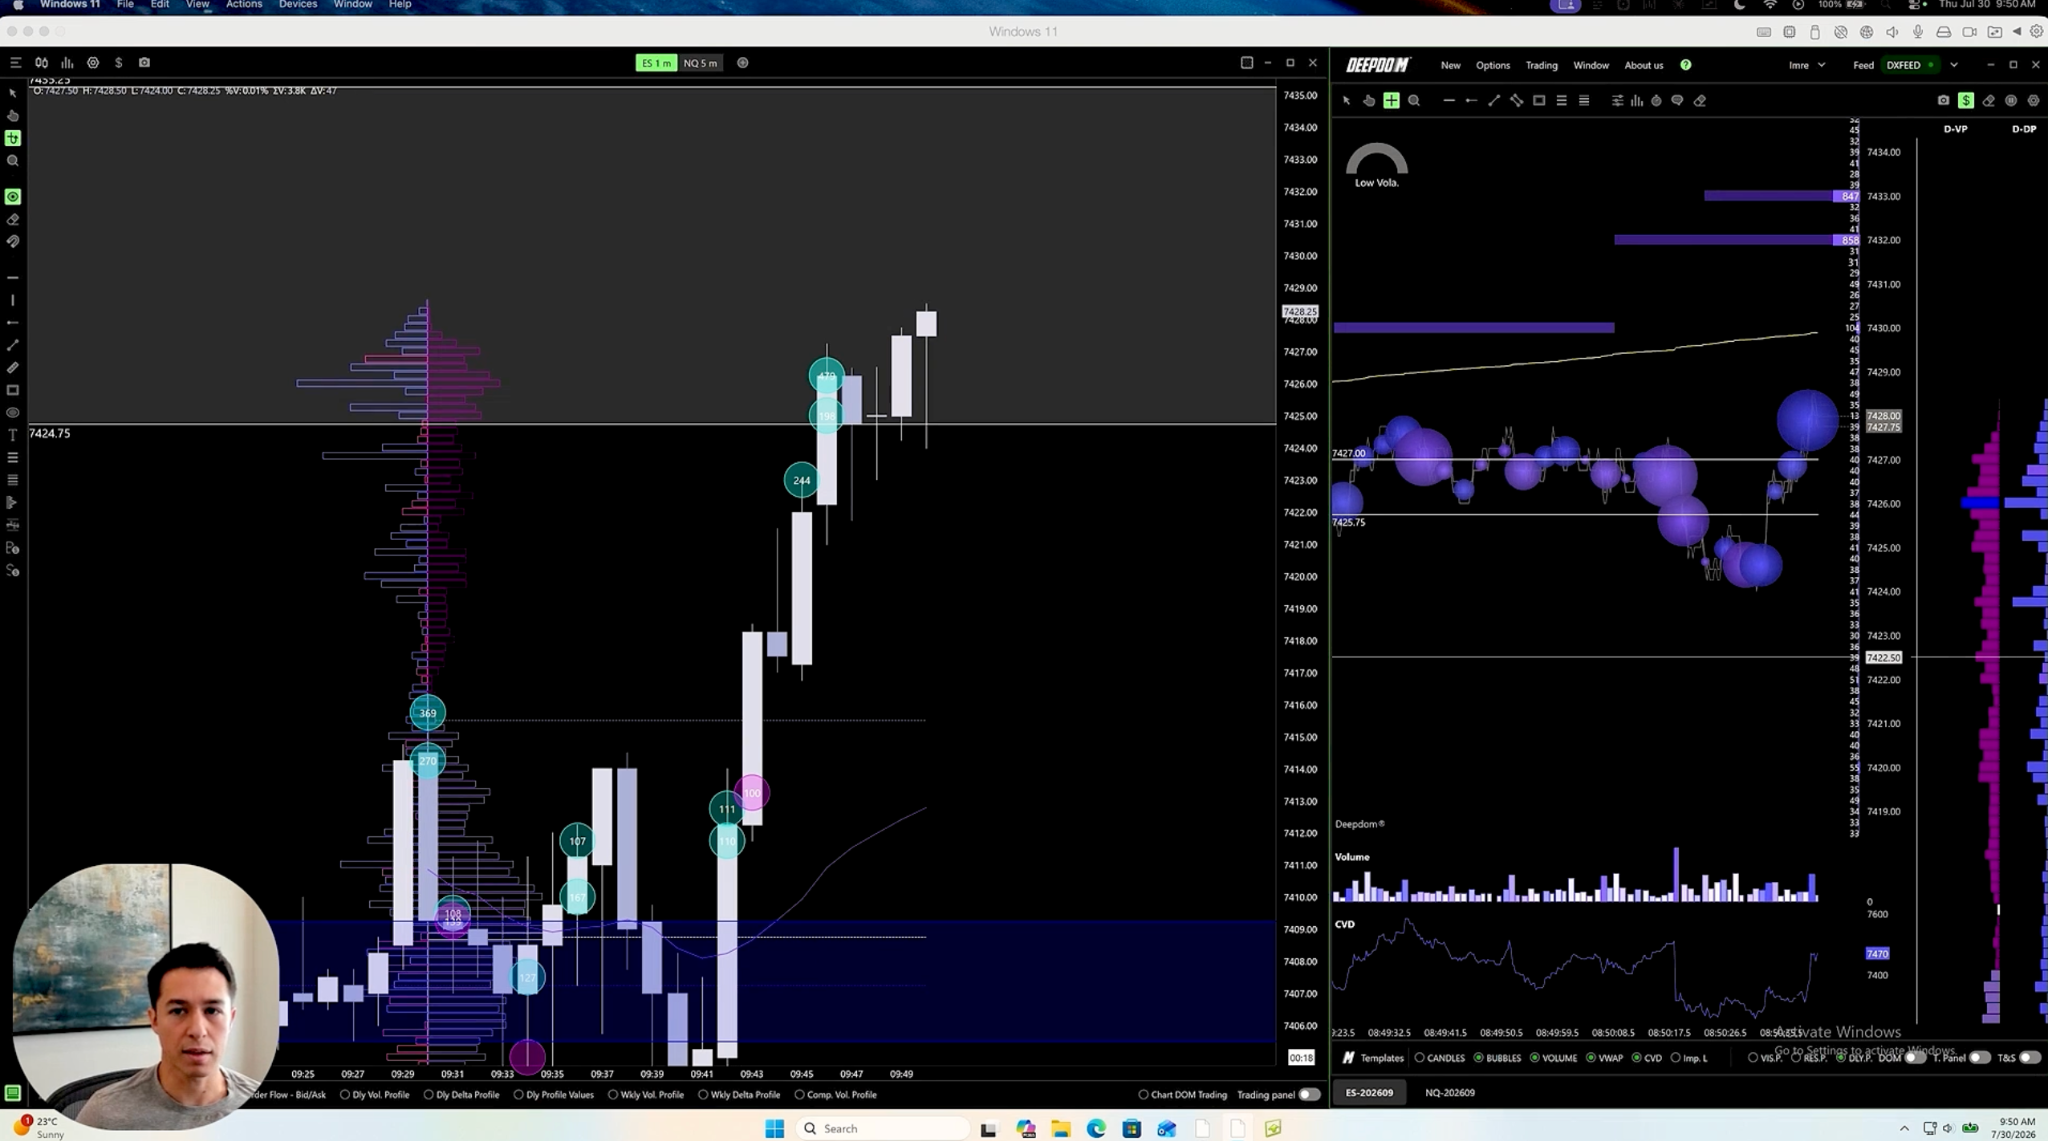
Price breaks out of the range. He plans a quick scalp if price pulls back to test the top of the range and holds, the “kiss and go,” with a move up toward 7430. On the first test, price does not find support at the range. The buyer at 7430 vanishes and moves up to 7432.
Screenshot: the retest of the upper boundary of the range.
Step 7: Entry on the reclaim
He extends the range boundary on the chart. Price had failed there but is now reclaiming it, so he buys at market for a quick scalp. A seller is showing at 7432.
Step 8: Exit at the top of the range (2:08:09 to 2:08:40)
Price pops higher and he takes the profit. He exits because that is the upper part of the range. A buyer delta of about 2,300 contracts on screen shows heavy aggressive buying.