

Built For
Instruments: Futures/ Forex
Trading Style: Day Trading/ Swing Trading
Strategy Overview
Dhesi Trades presents a reaction-based reversal and continuation model built around liquidity, fair value gaps, and lower-timeframe confirmation. The model starts from a higher-timeframe draw on liquidity, waits for the market to sweep or tap that area, then uses a fair value gap inversion to confirm that price delivery has shifted.
The edge is not simply finding a fair value gap. The edge is layering the context. A daily or monthly liquidity event sets the location, a higher-timeframe fair value gap inversion confirms the shift, and a lower-timeframe inversion gives the day-trade entry. For swing trades, the same structure can be used on the hourly, four-hour, daily, or monthly chart, with wider stops and more patience.
Dhesi emphasizes being reactionary rather than forcing a fixed bias. The model does not short every high or buy every gap. It waits for price to show a sweep, rejection, inversion, retracement, and confirmation sequence. Once the story is complete, the goal is to capture a clean piece of the move, trim into technical targets, and let runners do the work when volatility expands.
Built For
Instruments and Trading Style
The model is built primarily for NQ and ES futures, with Dhesi favoring NQ because it provides enough movement and volatility during the trading day. The same logic can be adapted to other liquid assets, but attention should not spread across too many tickers before the model is proven.
The strategy works as both a day-trading and swing-trading framework. Day trades use tighter execution windows and lower-timeframe confirmation. Swing trades use the same logic on larger structures and allow more time for price to move.
Timeframes and Timing
The core top-down stack is monthly, daily, four-hour, hourly, 15-minute, five-minute, and one-minute. For day trading, Dhesi commonly works from a higher-timeframe sweep or inversion, then refines the entry on the 15-minute, five-minute, or one-minute chart.
The New York session is central, especially around the 10:00 a.m. Eastern four-hour candle open. Moves before 10:00 a.m. can be noisy and directionless, so the model prefers waiting for the new four-hour candle to reveal whether price is sweeping liquidity, tapping a gap, or rejecting from a higher-timeframe PD array.
Tools and Skill Level
The model requires familiarity with liquidity draws, fair value gaps, inversion fair value gaps, PD arrays, order blocks, balanced price ranges, session highs and lows, monthly highs and lows, and equal highs or equal lows. It is best suited to an execution process that already understands ICT-style concepts and has enough journaled examples to identify which variations fit best.
Core Idea
The model begins with a draw on liquidity. That draw can be a monthly high or low, session high or low, equal highs, equal lows, a new week opening gap, an unfilled fair value gap, or a cluster of trendline liquidity. Dhesi gives priority to monthly highs and lows because they tend to produce stronger reactions.
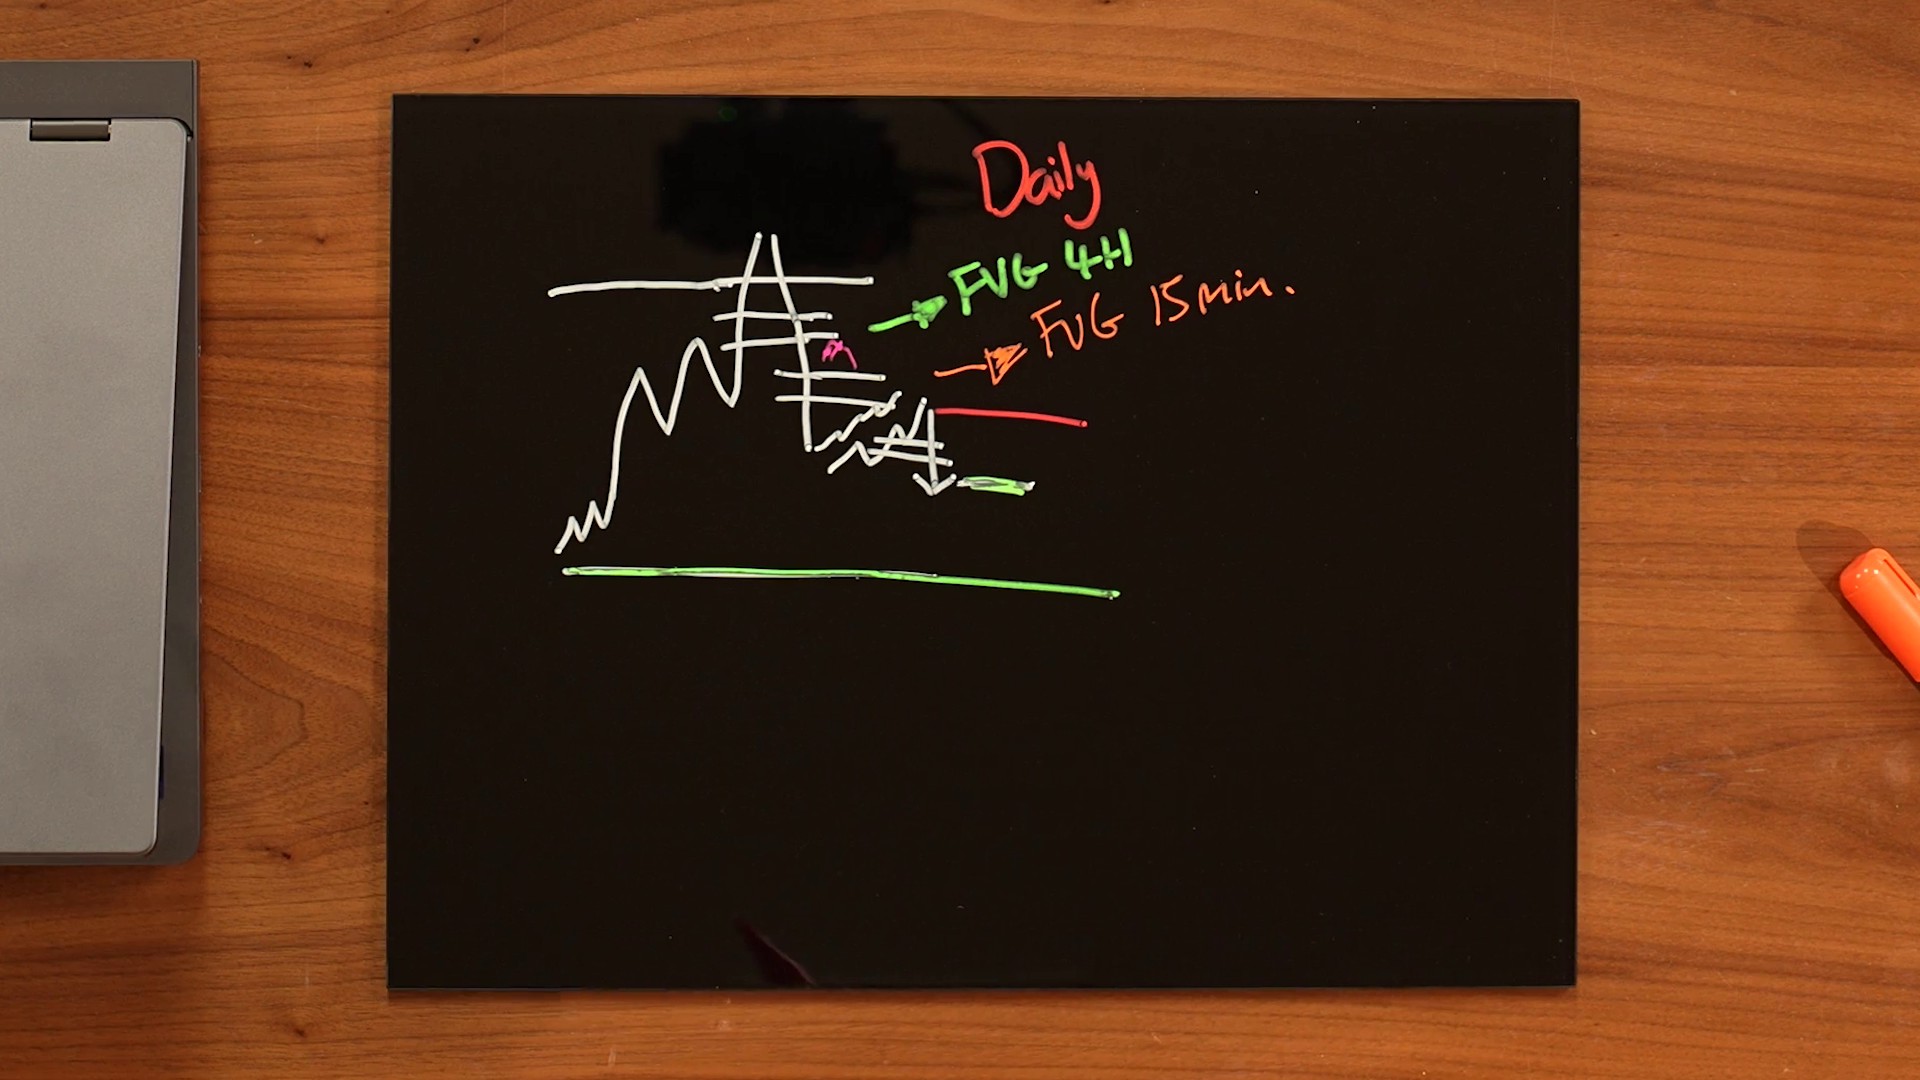
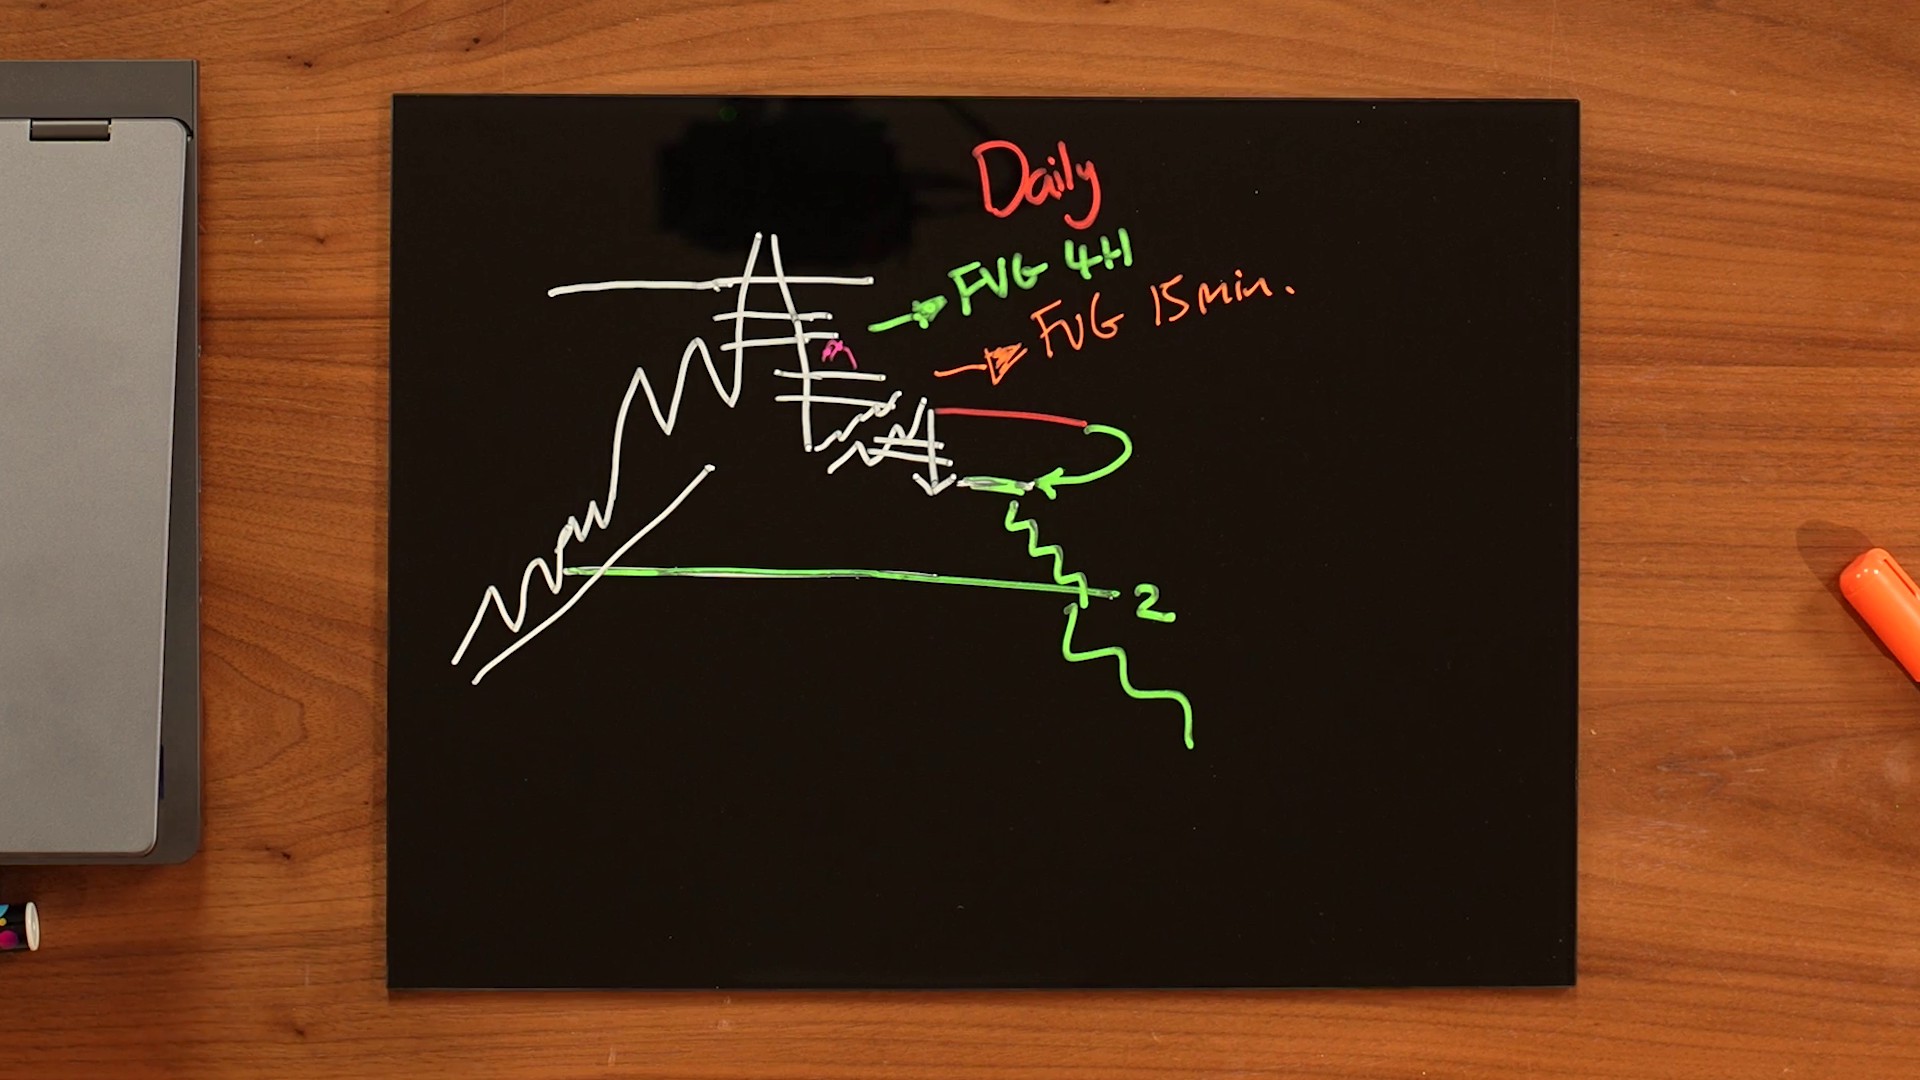
Once price reaches the liquidity area, the model waits for displacement and inversion. In a bearish reversal, price sweeps buy-side liquidity, creates or taps a higher-timeframe fair value gap, then violates that gap instead of respecting it. That violation becomes the inversion and shifts the focus from continuation to reversal.
For a day trade, the higher-timeframe inversion is only the setup environment. The actual entry comes from a lower-timeframe retracement into a bearish or bullish PD array, followed by a lower-timeframe inversion in the intended direction.
How the Setup Is Built
Step 1: Define the Draw on Liquidity
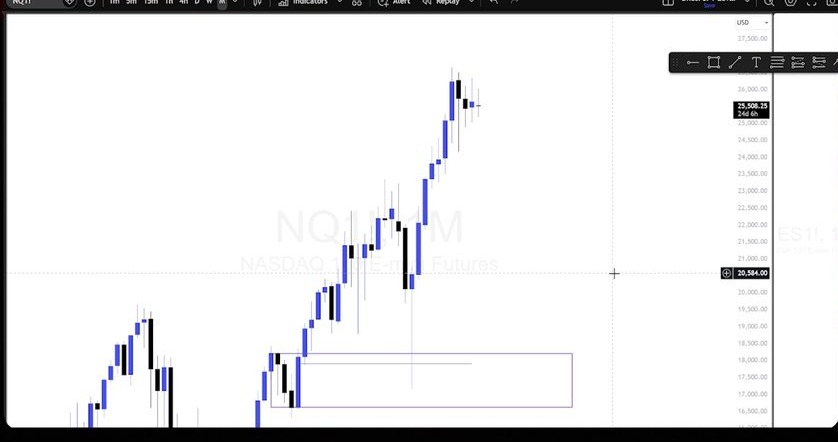
Start by marking the important liquidity pools. Dhesi looks for monthly highs and lows first, then session highs and lows, equal highs, equal lows, gaps, and obvious low-resistance liquidity such as stacked trendline lows. The setup becomes more powerful when the market is already moving with expanded volatility.
For a bearish reversal, the ideal context is a push into buy-side liquidity that fails to continue. For a bullish reversal, invert the logic: price sweeps sell-side liquidity, reacts from a higher-timeframe PD array, and begins to displace higher.
Step 2: Wait for the Higher-Timeframe Inversion
After the sweep, price should react with speed. Dhesi wants to see the market violate the relevant fair value gap within the next few candles, often within two or three candles. If price sits inside the gap for too long, the setup loses urgency.
The inversion is the point where the previous delivery fails. In a bearish version, a bullish fair value gap is broken and begins to act as resistance. In a bullish version, a bearish gap is broken and begins to act as support. This shift is what turns a liquidity event into a tradeable model.
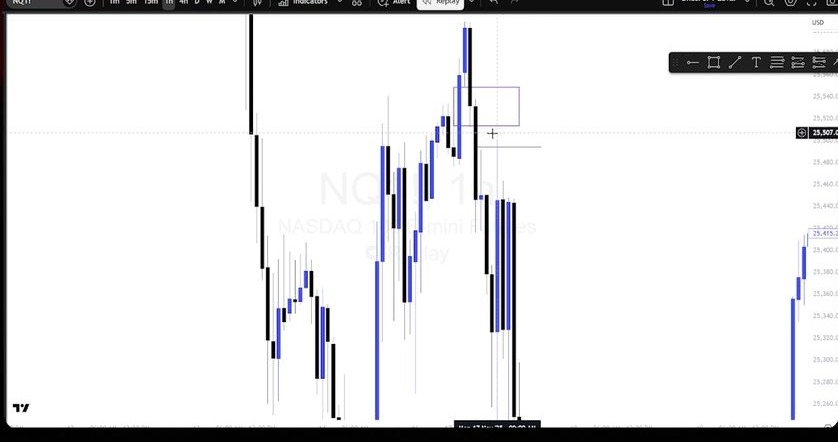
Step 3: Wait for Lower-Timeframe Confirmation
The lower-timeframe entry comes after price retraces into a PD array created during the new move. On a bearish day trade, price may retrace into a 15-minute fair value gap or order block while forming bullish lower-timeframe gaps on the way up. The entry is not the retracement itself. The entry appears when those bullish lower-timeframe structures are disrespected and inverted back down.
This is why Dhesi avoids chasing the large higher-timeframe candle. A big move often creates the trade idea, but the pullback and lower-timeframe inversion create the executable risk.
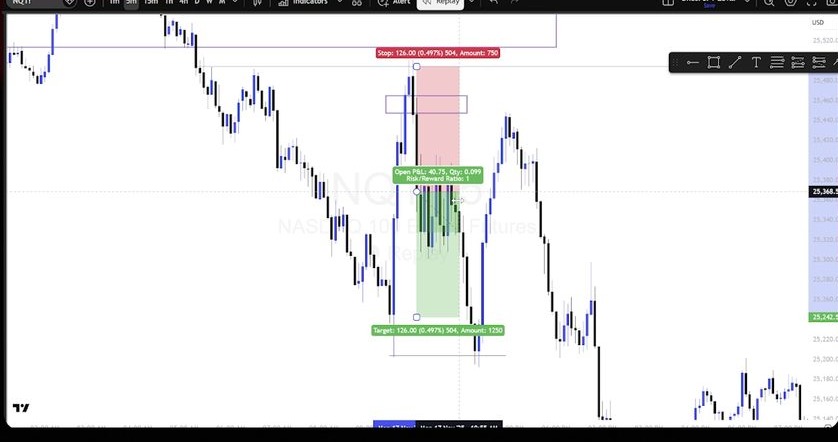
Step 4: Place the Stop Where the Chart Is Wrong
The stop belongs beyond the structural high or low that should remain protected if the setup is valid. In a bearish day trade, that often means above the current 15-minute high or above the lower-timeframe high that created the inversion. In a bullish continuation, the stop belongs below the low that should be protected if the fair value gap remains valid.
Dhesi prefers sizing down rather than using a stop that is too tight. The chart should invalidate the trade, not discomfort with the dollar amount.
Step 5: Take Technical Partials and Let Runners Work
The first target is always technical. It can be a local low, a session low, an unfilled hourly or daily fair value gap, equal lows, or the main liquidity objective. Dhesi often trims half at the first technical target and moves the stop to breakeven. If volatility is strong and the higher-timeframe draw remains open, the runner can create the outsized R multiple.
Strategy Rules
Be Reactionary First
The model does not require a fixed bullish or bearish opinion before price reaches the key area. It reacts to what price does at liquidity. If price sweeps and rejects, the next requirement is inversion. If price respects the gap and continues, the reversal idea is not confirmed.
Volatility Must Support the Trade
The best versions appear when volatility is elevated. Downside NQ moves are especially attractive because volatility expands and a 50-point idea can become a 200-point opportunity. If the market is only moving a few points and liquidity is not being attacked with force, the model is lower quality.
Use the Right Timeframe for the Objective
Day trades need lower-timeframe confirmation and precise timing. Swing trades should not be entered from the 15-minute, five-minute, or one-minute chart. For swings, Dhesi wants hourly or higher confirmation, preferably four-hour and daily structure, because the position needs room to survive normal lower-timeframe noise.
One Setup, One Clean Attempt
Dhesi generally avoids chasing after a missed entry. If the first clean entry is missed, he waits for the next session or the next four-hour candle. He does not like compounding into trades or averaging up except in rare, high-conviction higher-timeframe opportunities.
Two Losses Ends the Day
If two trades lose, the day is finished. If one trade wins and one loses, a third attempt can be allowed. This rule protects capital, protects mental state, and keeps execution tied to the tested model rather than the desire to win back a loss.
Entry Models
Bearish Reversal After Buy-Side Sweep
The bearish version begins when price trades into buy-side liquidity such as a monthly high, equal highs, or a session high. After the sweep, price must reject and violate the fair value gap or PD array that supported the move up. That creates the higher-timeframe inversion.
The day-trade entry comes from a lower-timeframe retracement into a bearish PD array, followed by a lower-timeframe inversion. The stop sits above the protected high. The first target is the nearest meaningful sell-side liquidity or local low, with runners aimed at larger stacked liquidity if the move expands.
Bullish Continuation Into Equal Highs
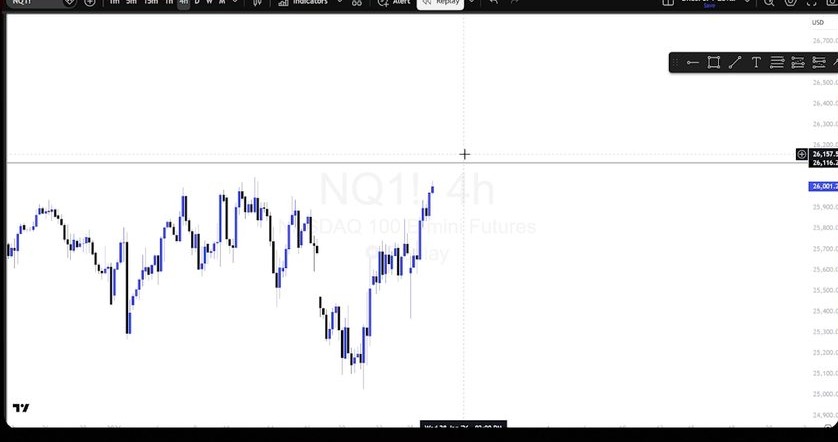
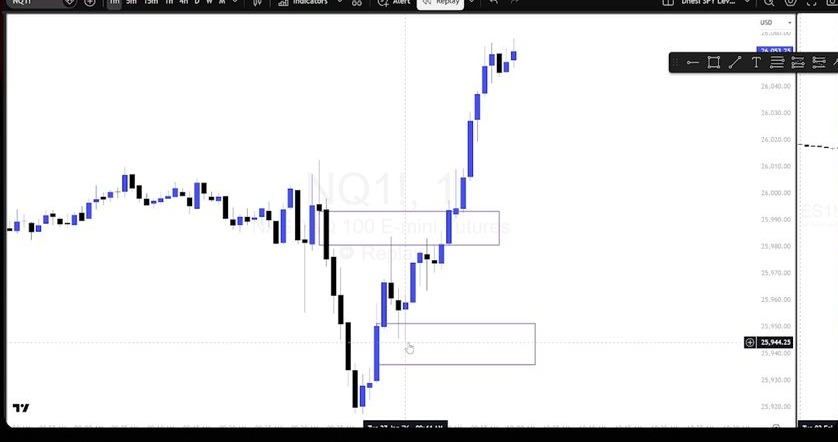
The bullish continuation version appears when the market is already expanding higher and a higher-timeframe fair value gap remains open below price. The setup waits for a retracement into that gap. If price reacts bullishly and then produces a lower-timeframe inversion, the entry can be taken in line with the continuation.
In the NQ continuation example, the draw was the 26,100 relative equal highs. Price had been rejected there multiple times, making the level a major buy-side liquidity pool. The setup waited for the four-hour fair value gap tap and then used the one-minute inversion for the actual entry.
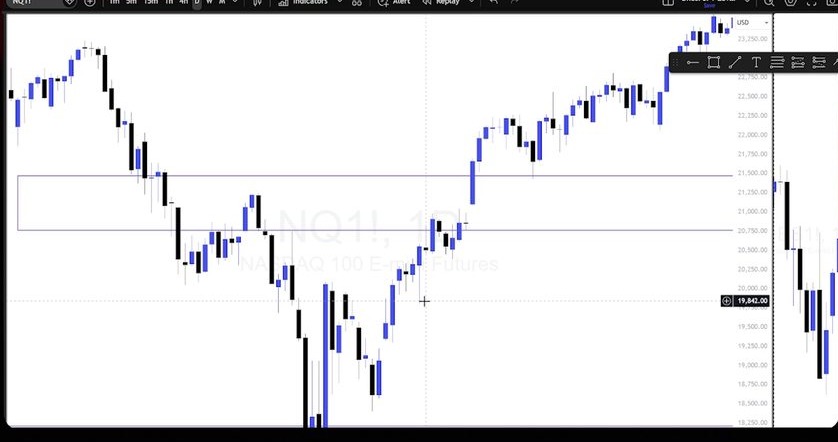
Higher-Timeframe Reversal for Swings and Leaps
The same logic works on monthly and daily charts. During the tariff-driven pullback, Dhesi looked for NQ to react from a monthly fair value gap and monthly order block. Once the monthly gap inverted back upward, that gave confirmation for longer-term positions and also made lower-timeframe day trades easier because the higher-timeframe bias was clear.
The higher the timeframe, the less intraday noise matters. A daily or monthly thesis needs a stop and target structure that match the larger chart.
Confirmation Rules
The model is confirmed through alignment, not through one isolated signal. A high-quality short has a higher-timeframe liquidity sweep, a strong rejection, an inversion of the relevant fair value gap, a retracement into a bearish PD array, and a lower-timeframe violation of the bullish structures created during that retracement.
Speed matters. Dhesi wants the reaction and inversion to happen with force. If price slowly drifts around the gap, the emotional pressure behind the move is weaker. The best setups create a sense that wrong-side participants are trapped and being forced to respond.
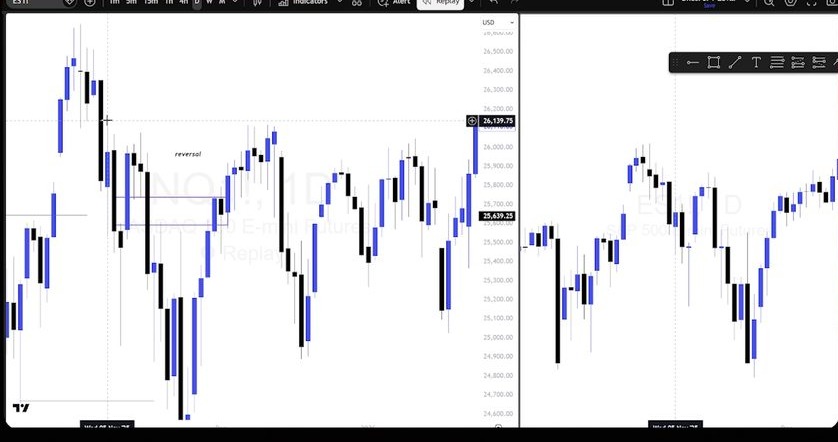
SMT between ES and NQ can add confidence, but it is not required. In the NQ reversal example, ES had already swept prior highs while NQ was working around the daily gap area, which gave extra bearish context. The trade still needed the inversion and lower-timeframe setup.
Risk Rules
The stop goes where the trade idea is wrong. For a bearish day trade, that often means above the high that forms before the lower-timeframe inversion. For a bullish continuation, the stop goes below the low that should be protected if the fair value gap reaction is real.
Dhesi is comfortable with drawdown when the chart demands a wider stop. If volatility is high and the structural stop is 40 or 50 NQ points away, the answer is to size down, not to compress the stop into a random level. The same dollar risk can be expressed through smaller size and wider invalidation.
Multiple attempts are limited. Two losses end the day. A win followed by a loss can allow one more attempt, but only if the setup presents again. Missed entries should not be chased into poor risk/reward.
Targets and Management
Targets come from the chart, not from dollar goals or arbitrary point counts. Dhesi uses local lows, local highs, unfilled fair value gaps, daily or weekly gaps, session lows, session highs, and stacked liquidity pools as target references.
The first partial is commonly 50% at the first technical target. After that, the stop moves to breakeven. If the runner stops out, the trade is still successful because the model delivered the base hit. If the higher-timeframe draw continues to pull price, the runner can turn a 1:1.5 or 1:2 idea into a much larger result.
No-Trade Rules
Do not chase the large displacement candle. The big candle identifies the opportunity, but the retracement and lower-timeframe confirmation create the executable trade.
Do not take a day-trade entry directly from a four-hour fair value gap without confirmation if the stop would be too wide for the account. Swing positions can tolerate wider stops because the objective is larger; day trades need confirmation that tightens the execution.
Do not enter swing trades from the 15-minute, five-minute, or one-minute chart. If the trade objective is a multi-day move, the entry logic should come from hourly or higher structure.
Do not keep trading after two losses. The rule exists to prevent revenge trading and forced entries after the model stops presenting cleanly.
Do not trade the model aggressively in dead volatility. If the market is not sweeping, displacing, and moving with force, the odds are weaker. Base hits are fine, but the full model is most powerful when volatility is active.
Trade Example
NQ November Reversal Into Swing and Day-Trade Shorts
The November NQ example begins after price trades around all-time highs and grabs buy-side liquidity. A new week opening gap above price created a high-probability draw to be filled, but the first selloff was not enough by itself. Dhesi wanted to see the daily fair value gap structure get violated and inverted before treating the market as a high-quality reversal.
Once the daily fair value gap inverted, the lower-timeframe work began. The four-hour chart looked messy, so he moved to the hourly chart, where the setup became clearer. Price retraced into the daily gap area, then the hourly structure produced the inversion. That created the swing short, with the stop above the current high and targets at relative equal lows and unfilled gaps below.
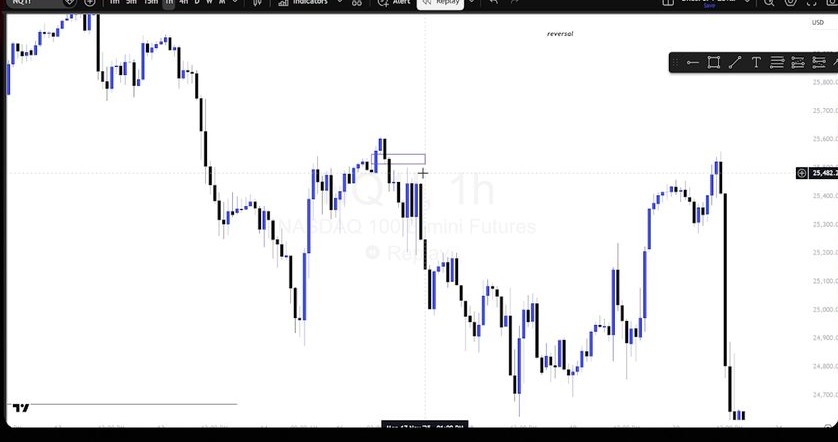
The same higher-timeframe idea also produced a New York day trade. Around the 10:00 a.m. four-hour candle, price swept equal highs and tapped an hourly fair value gap. On the five-minute chart, the first bullish PD array was not enough because an order block and fair value gap were stacked together. Dhesi waited for both to be violated. Once that happened, the short entry was valid, the stop belonged near the high, and the first target was the 9:30 a.m. session low.
The lesson is that one higher-timeframe setup can create multiple trade types. The swing position holds for the larger draw. The day trade takes a piece of the move, trims, moves to breakeven, and accepts that the rest may or may not continue.
Key Lessons
Dhesi's Liquidity Inversion Model is a layered framework. It starts with where liquidity sits, waits for the market to react there, confirms the shift with an inversion, and only then refines an entry. The same logic can build a scalp, day trade, swing trade, or leap position, but the timeframe and risk must match the objective.
The model rewards patience. It does not need the whole move and does not need aggressive trading every day. In defensive months, base hits are enough. When volatility expands and higher-timeframe liquidity aligns, the model gives permission to become more offensive.
Want to Learn More?
If you want to go beyond this one strategy and learn trading the right way, from the basics to advanced, Chart Academy is where to do it.
Chart Academy is the world's first free, all-in-one trading education platform, built to help traders learn real, practical skills from world-class traders. It offers in-depth masterclasses taught by professional traders across stocks, options, futures, forex, crypto, and trading psychology. Alongside the masterclasses, Chart Academy includes personalized learning paths, downloadable resources, and access to exclusive tools and rewards, all in one place. There are no subscriptions, no paywalls, and no credit card required. The goal is to make high-quality trading education accessible, practical, and easy to follow for traders of all levels.
Start learning for free on Chart Academy.


.svg)

.svg)