

Built For
Instruments: Stocks
Trading Style: Day Trading
Strategy Overview
Markets are generally efficient. Most of the time, prices reflect a balance between buyers and sellers, meaning the current price is close to the market’s equilibrium value.
However, there are moments when the price temporarily moves far away from equilibrium. These situations often occur when emotional reactions, forced liquidations, or sudden sentiment shifts push prices rapidly in one direction.
This strategy focuses on identifying those moments and trading the mean reversion back toward equilibrium.
Instead of trying to predict reversals randomly, the strategy waits for situations where the price has moved so far and so fast that the probability of a reversal becomes higher. Once momentum shifts and the trend begins to turn, the trade is taken in the direction of the reversal.
The goal is to capture the retracement that occurs after a capitulation move.
Core Principle: Expected Value
Every trade is evaluated based on expected value.
Expected value considers three factors:
- Probability of winning
- Size of the reward
- Size of the risk
The relationship can be expressed as:
Expected Value = (Win Rate × Reward) − (Loss Probability × Risk)
This strategy aims to find situations where:
- The probability of a reversal increases
- The potential reward expands because the price moved far from the equilibrium
- The risk can be clearly defined using the recent price structure
When those three elements align, the trade becomes attractive.
The Conditions That Create Mean Reversion Opportunities
Mean reversion does not occur randomly. Certain market conditions make it more likely that the price will return toward equilibrium.
The strategy evaluates several variables to determine whether a move is likely to reverse.
The more of these variables that appear together, the stronger the setup becomes.
Size of the Move
Small price movements rarely create opportunities. Large price moves attract attention and encourage new participants to act.
For example, a small change in price may not motivate traders to buy or sell. But when an asset moves significantly in a short period of time, traders begin to react.
The larger the move, the more likely it is that the price has temporarily moved away from equilibrium.
Speed of the Move
The speed of the move is one of the most important factors.
A move that occurs slowly over many months is very different from a move that happens in minutes or hours.
Fast moves often indicate:
- Panic selling
- Aggressive buying
- Forced liquidations
- Emotional decision making
Rapid acceleration in price increases the chance that the price has overshot the equilibrium.
News vs Fundamental Change
Another important question is whether the move was caused by a fundamental change.
If new information significantly changes the long-term value of an asset, then the equilibrium price may have shifted as well.
However, when a large move occurs without major new information, the move is more likely to be temporary.
In those cases, price often reverts back toward equilibrium.
Consecutive Bars or Days in One Direction
Markets rarely move in one direction indefinitely.
When an asset moves several bars or several days in the same direction, the probability of a reversal begins to increase.
This concept applies across all timeframes.
For example:
- Several daily candles are moving down in a row
- Multiple intraday candles pushing in the same direction
The longer the streak continues, the more likely the move becomes exhausted.
Forced Buying or Forced Selling
Sometimes, price moves because participants are forced to act rather than choosing to act.
Examples include:
- Margin calls
- Forced liquidations
- Short covering
- Redemption pressure
These forced flows can temporarily push the price far away from fair value. Once the forced activity ends, the price often moves back toward equilibrium.
Sentiment Extremes
Sentiment can push markets to emotional extremes.
Sometimes traders become overly optimistic, and the price reflects unrealistic expectations.
Other times, sentiment becomes extremely negative, and markets assume the worst possible outcome.
Both situations create opportunities for mean reversion once the emotional pressure fades.
Stability and Market Structure
Some assets are more stable than others.
Large, diversified companies or widely traded markets often attract buyers quickly during panic moves.
Smaller or less stable assets may behave less predictably.
Stable assets that suddenly experience extreme volatility can present strong mean reversion opportunities.
Quantifiable vs Non-Quantifiable Assets
Assets with clear valuation models can sometimes revert more reliably.
For example:
- Bonds have known maturity values
- Companies produce cash flows
Assets that rely purely on supply and demand can behave more unpredictably, although they may still produce mean reversion setups.
Structural Difference Between Long and Short Trades
Buying and shorting are not structurally identical.
When buying an asset, the maximum loss is limited because the price cannot fall below zero.
When shorting, losses are theoretically unlimited because the price can continue rising.
Because of this, short trades require additional risk management.
The Ideal Setup
The strongest setups occur when a normally stable asset suddenly makes an extreme move.
This shift from calm behavior to sudden volatility is a key signal that the price may have moved too far away from equilibrium.
Typical characteristics include:
- Rapid price acceleration
- Large candles compared to the normal ranges
- High trading volume
- Price far from moving averages
- Emotional market behavior
When these factors appear together, the probability of a reversal increases.
Volume and Capitulation
Volume plays an important role in identifying capitulation.
During extreme moves, volume often spikes significantly compared to normal levels.
This increase in volume suggests that a large number of market participants are reacting simultaneously, often due to panic or forced liquidation.
When extreme price movement occurs alongside unusually high volume, it can signal that the move is nearing exhaustion.
Multi-Timeframe Context
The strategy evaluates both daily and intraday charts.
The daily chart helps determine whether the move is abnormal relative to the asset’s normal behavior.
The intraday chart helps identify:
- the capitulation point
- the reversal signal
- the precise entry location
Using both perspectives improves trade selection.
Entry Concept: Trading the Right Side of the Move
The strategy avoids trying to catch exact tops or bottoms.
Instead, it waits for confirmation that the move has turned.
This approach can be described as trading the right side of the reversal.
Rather than buying while price is still falling, the trade is taken only after price begins moving upward.
This allows risk to be defined clearly.
Entry Triggers
Several signals can confirm that the reversal has begun.
Break of Prior Bar Highs
If price has been trending downward while respecting prior bar highs, the reversal begins when those highs are broken.
The break signals a shift in momentum. The entry occurs on that breakout.
Break of Prior Bar Lows
If price has been trending upward while holding prior bar lows, the reversal begins when those lows are broken.
This indicates that buyers have lost control of the trend. The entry occurs on the downside break.
Trend Structure Shift
Another confirmation occurs when a downtrend of lower highs and lower lows transitions into higher highs and higher lows.
This change in structure indicates that momentum has shifted.
Extreme Panic Reversal
In rare situations where the move is extremely fast, the reversal may occur within a single candle.
In these cases, waiting for confirmation may cause the majority of the move to be missed.
A trader may enter as the candle begins reversing, but position size should be smaller because the risk is less clearly defined.
Stop Placement
Stops should be placed where the trade idea becomes invalid.
Common stop locations include:
- The low of the capitulation move
- The point where the reversal structure fails
- The level where higher lows are broken
The stop must clearly define the risk of the trade.
Profit Targets
After extreme moves, the price often returns toward equilibrium.
A useful reference for equilibrium is the 20-period moving average, which represents the center of the Bollinger Bands.
The first bounce often moves toward this level.
It is important to remain realistic about targets.
After a panic move, the price may retrace part of the move rather than immediately returning to previous highs.
The strategy focuses on capturing the initial retracement toward equilibrium.
Trade Management
After entering the trade, the position can be managed by a trailing price structure.
For long trades, a common method is trailing the stop below prior bar lows.
For short trades, the stop can be trailed above prior bar highs.
This allows the trade to continue if momentum remains strong while protecting profits if the move stalls.
Finding Opportunities
Rather than focusing on specific assets every day, the strategy searches for markets displaying extreme behavior.
Scanning methods can include identifying assets that are:
- Trading above or below Bollinger Bands
- Moving several days in one direction
- Experiencing large price expansions
- Showing unusually high volume
The asset showing the strongest setup becomes the trading opportunity.
Evaluating Trade Quality
Not all setups are equal.
Each trade should be evaluated based on how many favorable variables are present.
Examples of strong conditions include:
- Extreme price displacement
- Rapid acceleration
- Large volume spikes
- Distance from equilibrium
- Clean price structure
- Multiple legs in the same direction
Higher quality setups may justify larger position sizes. Lower quality setups may be traded smaller or avoided entirely.
Common Mistakes
Buying Too Early
Many traders repeatedly buy while the price is still falling instead of waiting for the reversal. This often leads to multiple losses before the move finally turns.
Waiting for confirmation helps avoid this problem.
Trading Slow Trends
Slow, steady trends may continue rather than reverse sharply. The strategy works best during fast and emotional moves.
Ignoring Context
Looking only at intraday charts without considering the larger context can lead to poor decisions.
Evaluating both timeframes improves trade selection.
Holding Unrealistic Targets
After a panic move, traders sometimes expect price to return immediately to previous highs.
In many cases, the first bounce only retraces part of the move. Setting realistic targets improves consistency.
Trade Breakdown
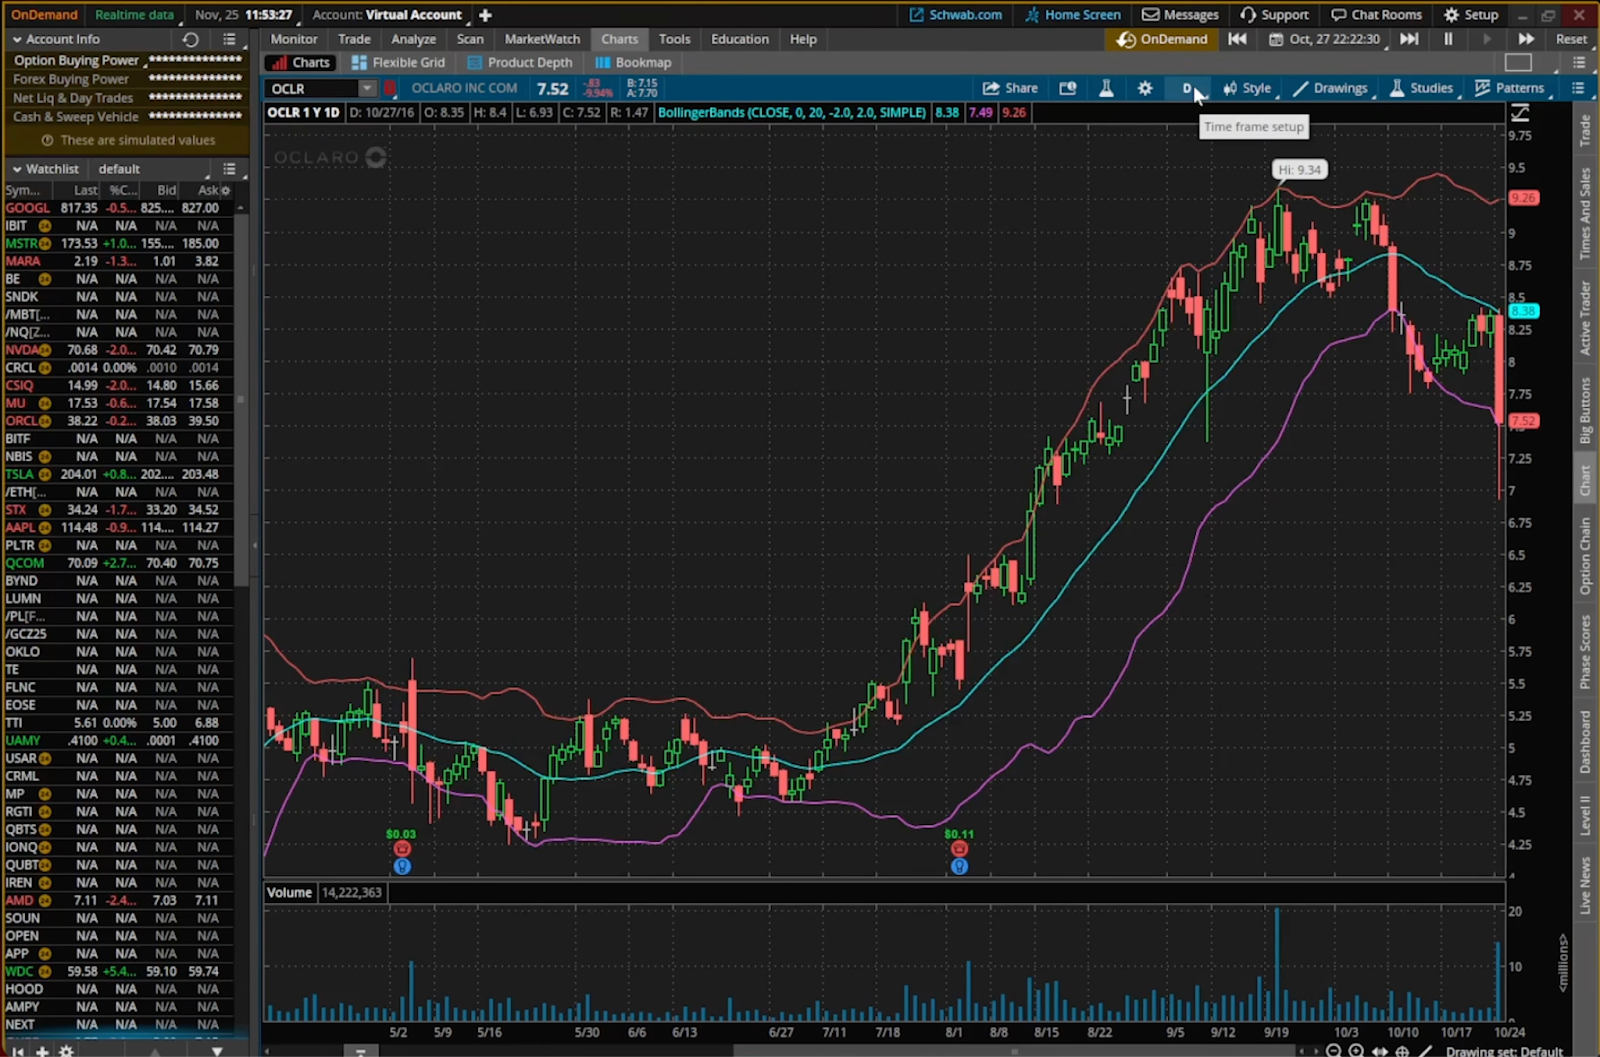
Trade Example 1: Oclaro (OCLR) Capitulation Reversal
Market Context
This trade occurred on October 27, 2016, in the semiconductor stock Oclaro (OCLR).
Before the capitulation move, the stock was behaving in a relatively stable and controlled manner. Price was trending down slowly after the market opened, with small and orderly candles.
The initial price movement represented a steady decline, suggesting the market was gradually moving lower without panic.
However, as the session progressed, the selling pressure began to accelerate.
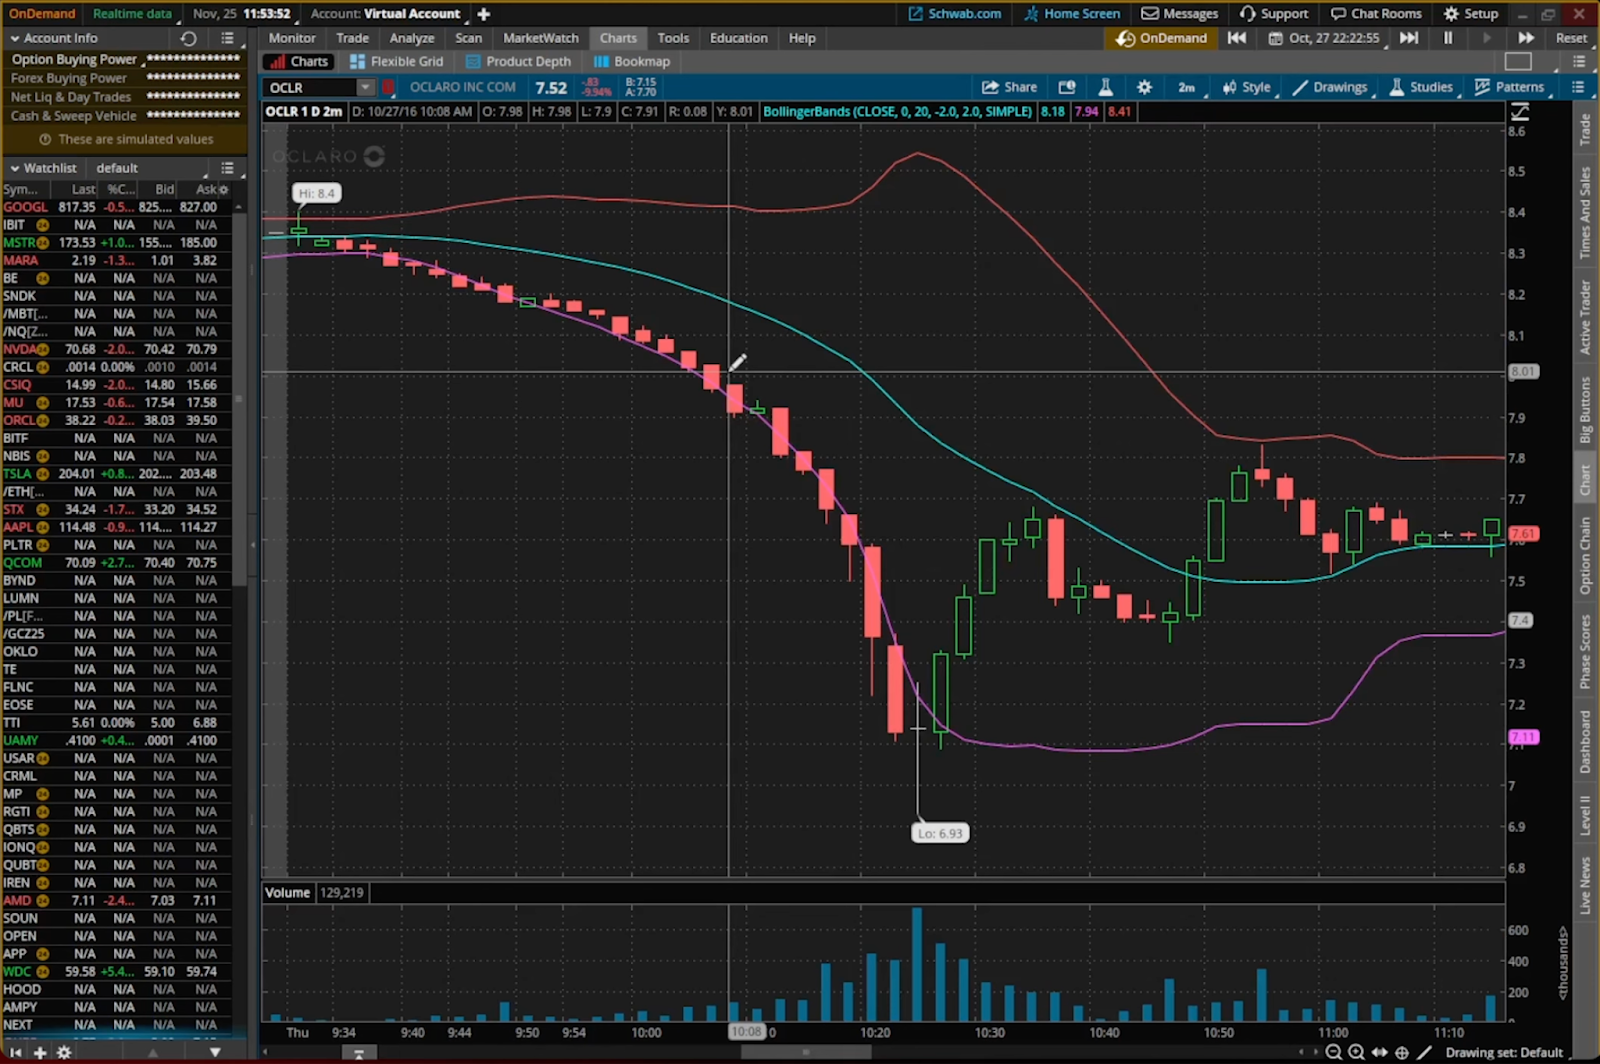
Step 1: Identifying the Capitulation Move
After the initial steady decline, the rate of selling began to increase significantly.
The move developed in three phases:
- Slow decline after the open
- Acceleration of selling pressure
- Final capitulation drop
As the move progressed, several key signals appeared:
- The rate of decline became steeper
- Candle size expanded dramatically compared to earlier bars
- Volume increased sharply
- The stock dropped roughly 20–25% within the session
Another important observation was the comparison to the stock’s normal daily trading range.
On typical days, the stock moved about 30 cents per day. During this sell-off, price began moving 30 cents per bar, showing how abnormal the volatility had become.
This rapid expansion in volatility and volume indicated capitulation selling, where traders were exiting positions aggressively.
Step 2: Daily Chart Context
Looking at the daily chart added additional confirmation.
Before this move:
- The stock had not been trending aggressively
- Price had been relatively stable
- Daily volatility was normally small
This meant the intraday move represented an extreme deviation from normal behavior, which increased the probability of a mean reversion bounce.
The combination of:
- abnormal volatility
- extreme volume
- unusually large price movement
suggested that the sell-off may have reached exhaustion.
Step 3: Entry Trigger
Throughout the decline, price continued to move lower while respecting prior bar highs.
This created a clean intraday downtrend. The entry occurred when the trend structure finally broke.
The reversal signal was the break of the prior bar high, which occurred around $7.25.
This break indicated that downward momentum had stopped and buyers were beginning to step in.
Entering on the break allowed the trade to be taken after confirmation of the reversal, rather than attempting to catch the exact bottom.
Step 4: Stop Placement
The stop was placed below the low of the capitulation move, which was near $7.00.
This level represented the point where the trade idea would become invalid.
If the price broke below that low again, it would suggest that selling pressure had not yet finished. By using the low of the move as the stop, risk remained clearly defined.
Step 5: Trade Management
Once the price began moving higher, the trade was managed by trailing the stop below prior bar lows. This allowed the position to remain open while the reversal developed.
The bounce progressed steadily upward as buyers entered the market after the panic selling ended.
Step 6: Exit
The bounce continued until the price reached approximately $7.57, where the position was closed.
This level was close to the 20-period moving average, which often acts as a return point for the price after extreme moves.
The move back toward this equilibrium level represented a typical outcome for a capitulation mean reversion trade.
Why This Trade Worked
This trade displayed several of the key characteristics of a strong mean reversion setup:
- Large and rapid price decline
- Accelerating rate of change
- Volume spike signaling capitulation
- Move far beyond the stock’s normal volatility
- Clean trend structure during the sell-off
- Clear reversal signal through the break of prior bar highs
When these factors aligned, the probability of a bounce increased significantly.
Trade Example 2: Kodak (KODK) Capitulation Reversal
Market Context
This trade occurred during the massive rally in Kodak (KODK) after the company announced news related to a government loan program.
Following the announcement, the stock experienced an extremely aggressive rally as traders rushed to buy shares.
At the start of the move, the price was already trending higher, but the rally soon began to accelerate rapidly. The candles became much larger, volume increased significantly, and price started moving far beyond its normal trading range.
As the rally continued, the move became parabolic, meaning the rate of change increased sharply. Price was rising much faster than usual, which suggested that the move was being driven by emotional buying and speculation.
This type of rapid expansion often leads to exhaustion once the buying pressure slows.
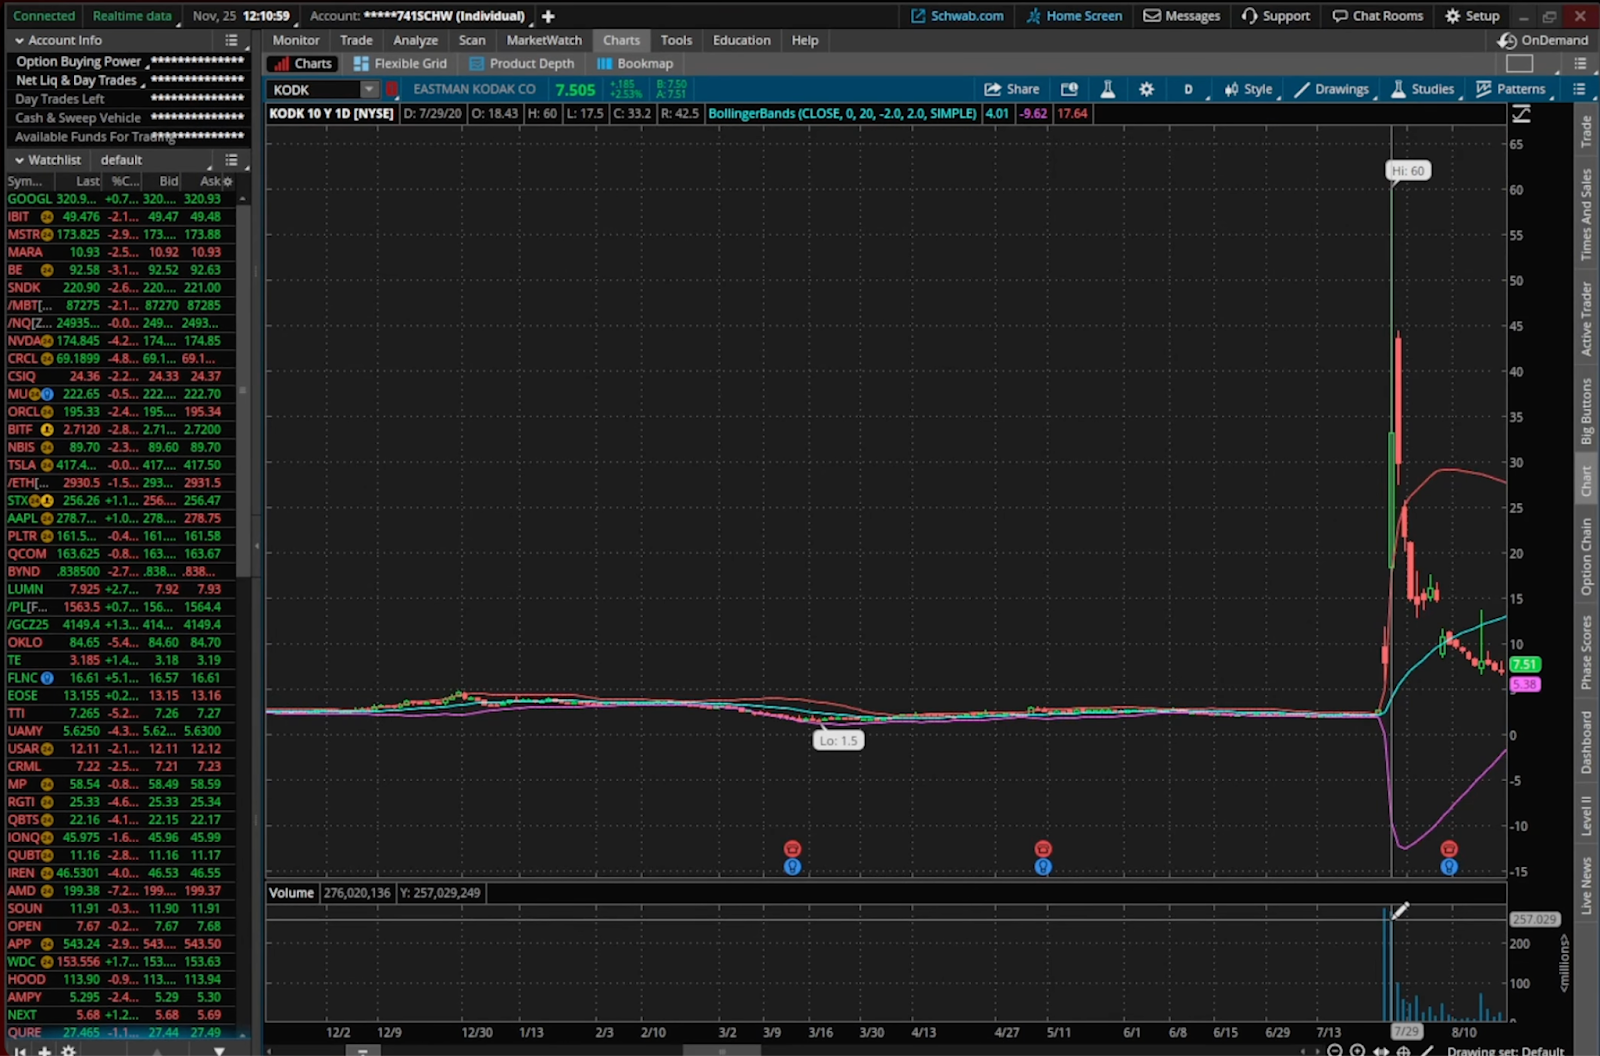
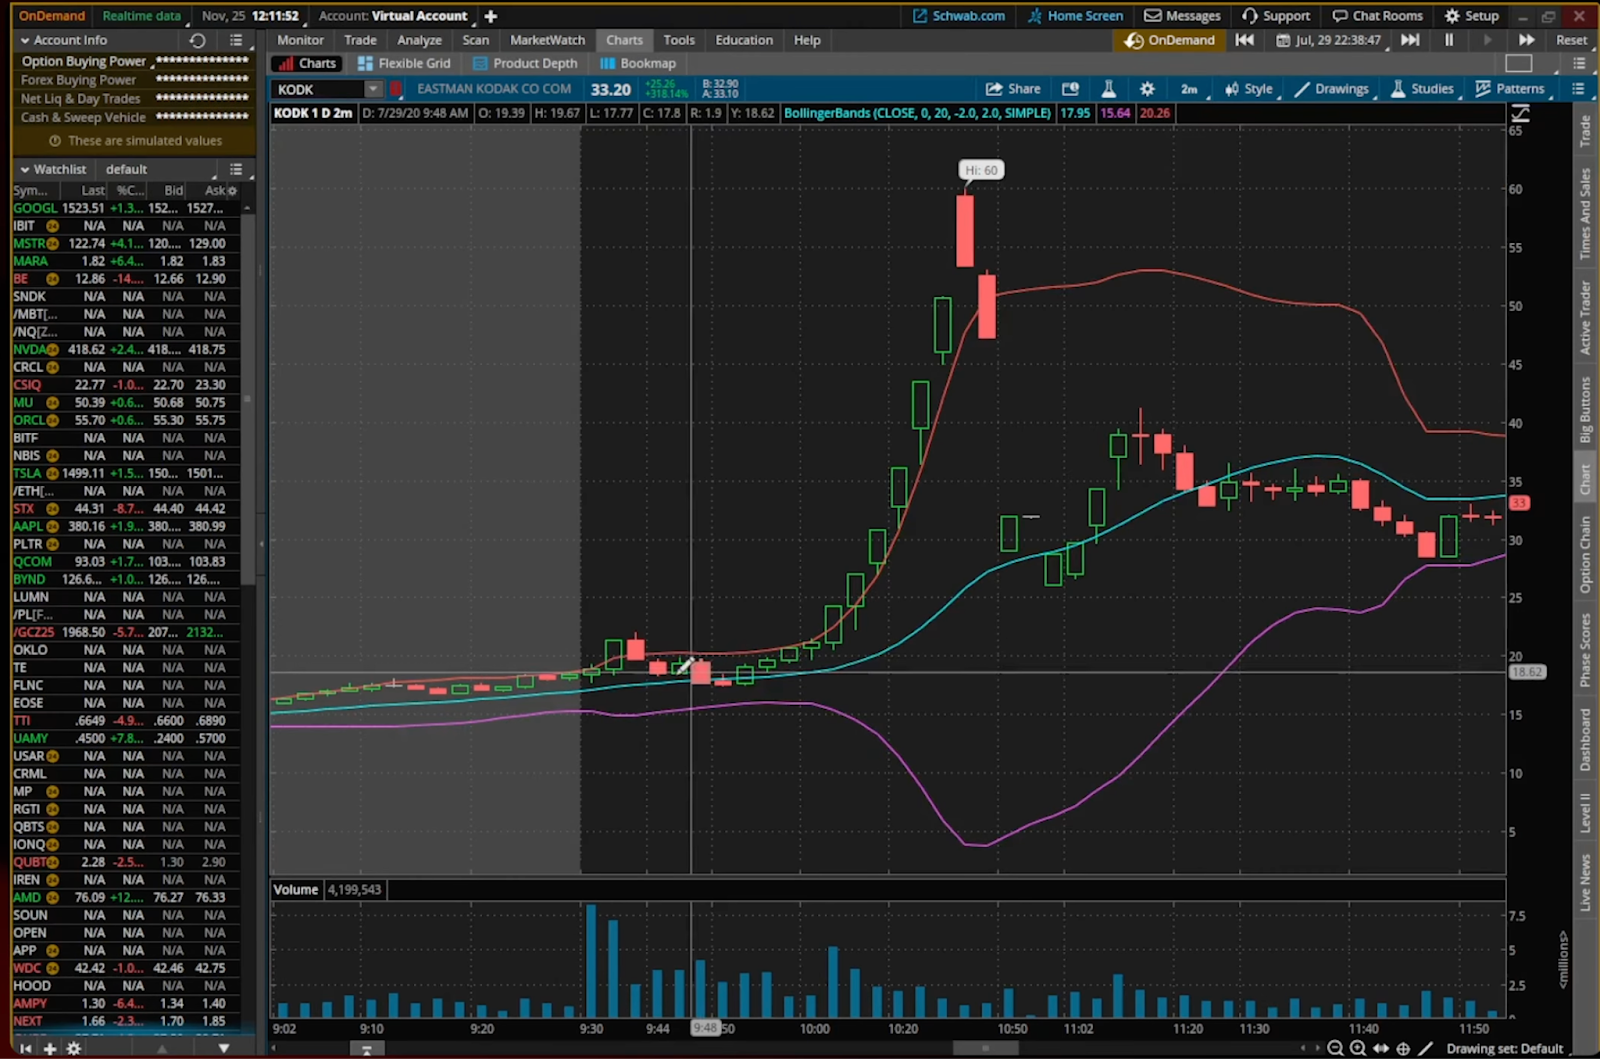
Step 1: Identifying the Blow-Off Move
As the rally developed, several key signs appeared:
- Price was rising extremely quickly
- Candle sizes increased dramatically
- Volume expanded significantly
- The move became much larger than the stock’s typical range
These conditions indicated that the stock had moved far away from equilibrium and that the rally may be reaching exhaustion.
Parabolic moves like this often end with a blow-off top, where buyers rush in aggressively before momentum suddenly fades.
Step 2: Entry Trigger
During the rally, the price continued moving higher while respecting prior bar lows, which created a strong uptrend.
The reversal signal appeared when this pattern finally broke.
When the price broke below the prior bar low, it signaled that buyers were losing control and momentum had shifted.
The trade was taken short after this break, entering once the reversal began rather than trying to pick the exact top.
Step 3: Stop Placement
The stop was placed above the high of the parabolic move.
If the price moved above this level again, it would indicate that the rally was continuing and that the reversal had failed.
Step 4: Trade Management
After the reversal began, the position was managed by trailing the stop using prior bar highs.
This allowed the trade to remain open while price continued moving lower as the emotional buying pressure faded.
Step 5: Exit
As the momentum shifted, price began retracing a portion of the parabolic rally.
The trade captured the initial pullback after the blow-off move, as price moved back toward equilibrium.
Why This Trade Worked
This trade displayed several of the key characteristics of a strong mean reversion setup:
- Extreme and rapid price expansion
- Parabolic acceleration
- Large volume spikes
- Price far above equilibrium
- Clear break of trend structure
Once these conditions appeared and the trend structure broke, the probability of a reversal increased significantly.


.svg)

.svg)