

Built For
Instruments: Futures (NQ)
Trading Style: Scalping
Strategy Overview
This strategy combines higher-timeframe liquidity analysis, market structure, and order-flow confirmation to identify high-probability scalping opportunities in Nasdaq futures.
The core idea is simple: start with the bigger picture, identify where liquidity is likely to be targeted, wait for price to show its intentions through structure and volume, and then use order flow to confirm the entry.
Rather than relying on a single pattern, this approach uses a multi-step decision-making process. The entry model itself is not the edge. The edge comes from understanding where the market is likely to move, how it reacts when liquidity is taken, and whether buyers or sellers are actually in control.
The strategy combines concepts from ICT, Dow Theory, volume analysis, and Bookmap order flow to create a complete framework for both reversals and continuations.
Timeframes
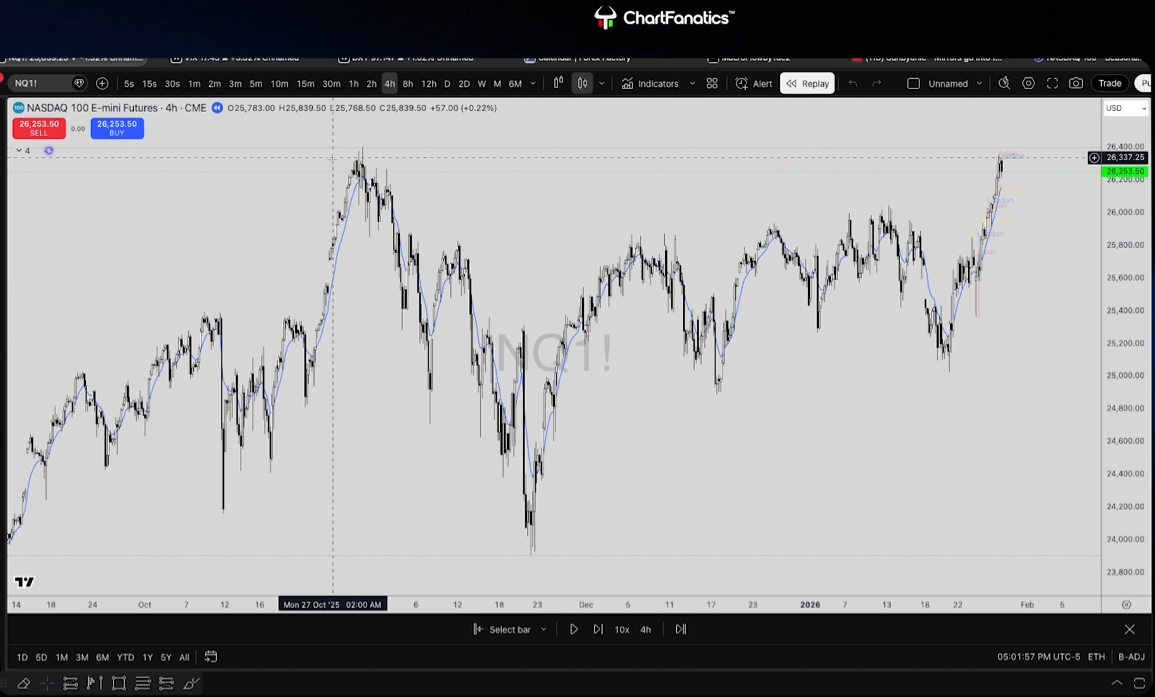
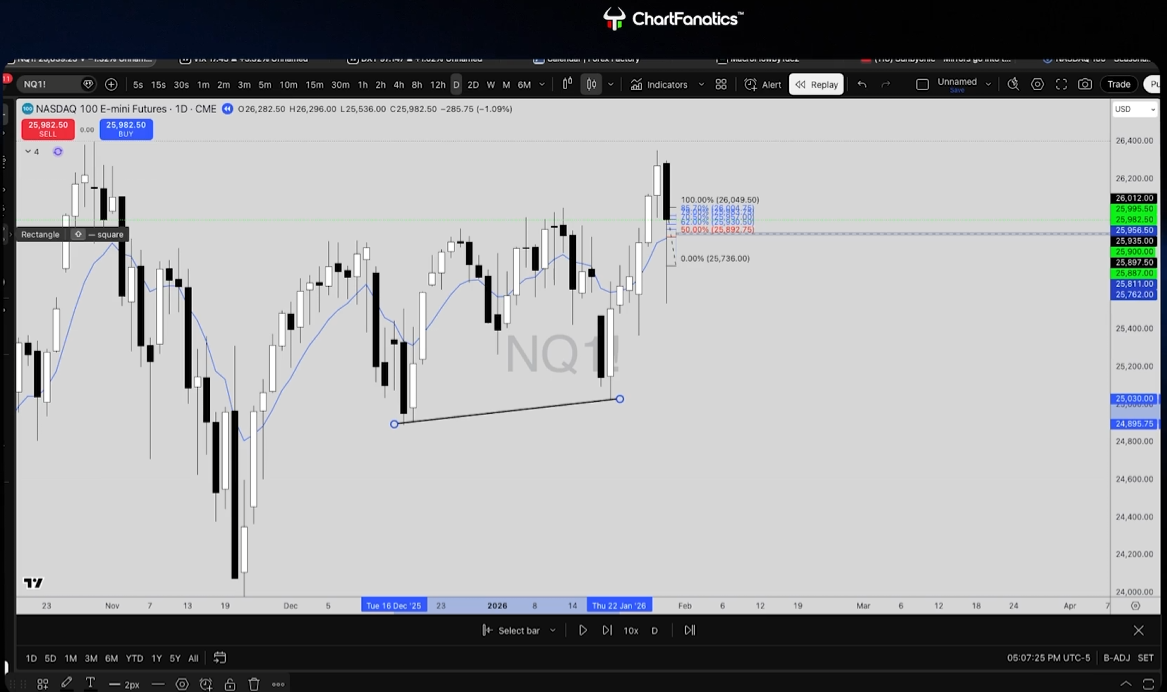
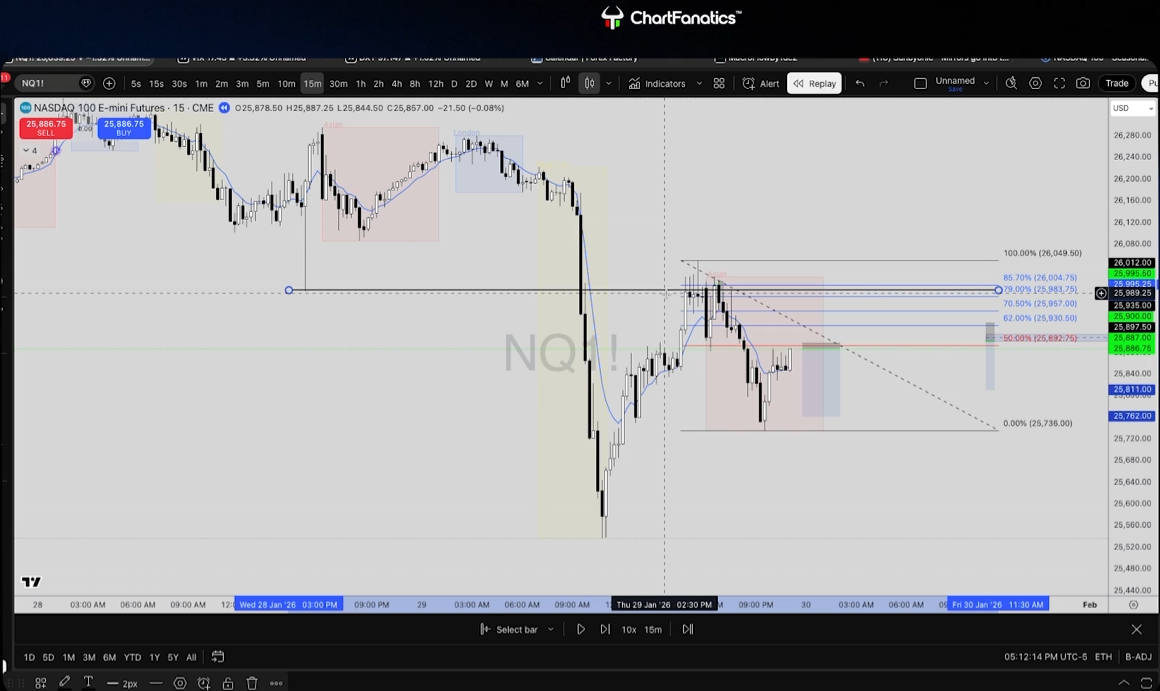
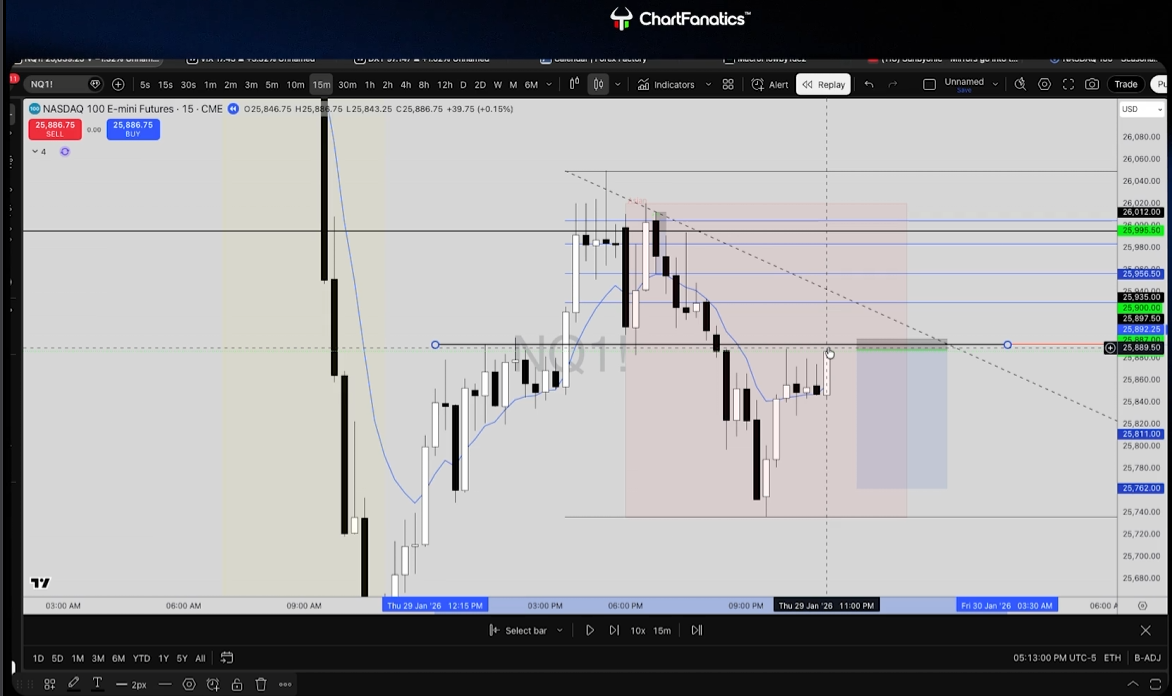
The strategy starts from the higher timeframes and then works down into lower-timeframe execution. The Daily and 4-Hour charts are used for market context. The 1-Hour and 15-Minute charts are used to confirm structure. The 1-Minute chart and seconds charts are used for entry refinement when the setup is ready.
Sessions
Asia and New York are the main sessions discussed. Abraham notes that Asia on Nasdaq can be cleaner when everything lines up because there is often less manipulation and smoother follow-through. New York can still provide strong opportunities, but it may require more patience because the session can be more manipulated, balanced, or choppy.
London is usually less attractive for this specific Nasdaq scalping approach.
Skill Level
This strategy is best suited for discretionary traders who can read market structure, liquidity, volume, and Bookmap. It is not a simple mechanical pattern strategy. The trader needs to understand context first, then use the entry model only when the rest of the conditions are aligned.
Core Idea
This strategy runs in three steps:
Step 1: Find the bias.
Step 2: Wait for liquidity to be taken.
Step 3: Enter only when structure and order flow confirm the move.
The process should not begin on the 1-Minute chart. Starting too low can cause traders to chase random setups without understanding the bigger picture. Abraham starts higher, figures out what the market is doing, and only then looks for a scalp.
How the Setup Is Built
Step 1: Start with Context
Begin with the Daily and 4-Hour charts. The goal is to understand the overall condition of the market before looking for any entry.
At this stage, look for the likely direction of the market, where external liquidity is located, whether price is trending or rotating, and where the next reaction area may be. External liquidity is usually found above major highs or below major lows, while internal liquidity can become important after a larger liquidity pool has already been taken.
If the market is in an uptrend, price may continue targeting upside liquidity, but it can still raid downside liquidity before continuing higher. If the market is in a downtrend, price may continue targeting downside liquidity, but it can still raid upside liquidity before continuing lower.
The main question is: where is the market most likely to raid liquidity first?
Step 2: Check Secondary Structure
After the higher-timeframe context is clear, move down to the 1-Hour and 15-Minute charts. This is where the trader checks whether the lower-timeframe structure still supports the higher-timeframe idea.
Abraham wants to see the market prove itself before he looks for an entry. A move without volume is not enough. A setup that looks clean but has weak structure is not enough either.
A stronger setup usually includes:
- Displacement in the intended direction
- A strong close, not just a wick
- Volume showing real intent
- Structure that supports the higher-timeframe bias
Volume is especially important because Abraham uses it to confirm intent. If price moves aggressively but volume does not support the move, the setup becomes weaker.
Step 3: Use the Entry Model
The ICT pattern is only the trigger, not the whole setup. Abraham makes it clear that the entry model is not the confirmation by itself.
Before entering, the trader should ask:
- Did price take liquidity?
- Did structure shift?
- Is volume supporting the move?
- Is order flow supporting the direction?
- Is Bookmap showing aggression on the correct side?
If these pieces do not line up, there is no trade. Even if the IFVG, retest, or continuation pattern appears, the setup should be ignored if order flow and structure are not confirming it.
Strategy Rules
Bias Rules
The bias starts with the higher timeframes. Use the Daily and 4-Hour charts to understand the bigger picture, then use the 1-Hour and 15-Minute charts to confirm whether the structure still supports that idea.
After external liquidity is taken, look for a potential pullback into internal liquidity or the next reaction zone. However, do not short just because a high gets swept, and do not buy just because a low gets swept. A liquidity sweep alone is not enough.
The market must show weakness, strength, structure, and volume all working together before the setup becomes valid.
Setup Qualification
For a trade to be valid, liquidity should be involved first. Abraham prefers waiting for the market to take liquidity rather than trying to front-run the move.
Common liquidity areas include:
- Prior highs and lows
- Equal highs and equal lows
- Obvious liquidity pools
- Prior support and resistance
The setup improves after liquidity has already been taken because the trader is no longer guessing where the market might go. Instead, the trader is watching how price reacts after liquidity has been raided.
A valid setup should show clear confirmation. Abraham looks for displacement with volume, a strong close in the intended direction, a meaningful structural shift, and Bookmap showing aggressive participants on the intended side. POC or VWAP should also support the trade direction by acting as support or resistance in favor of the idea.
If the Bookmap view looks balanced and neither side has control, the correct decision is to wait.
Liquidity Sweep Does Not Mean Automatic Reversal
One of the most important lessons in this strategy is that a liquidity sweep by itself is not a trade signal.
Many traders assume that if price sweeps a high, it must reverse lower. Abraham warns against this because sometimes price takes liquidity and continues in the same direction. The sweep only tells the trader that liquidity has been taken. It does not confirm that buyers or sellers have taken control.
After liquidity is taken, the trader still needs structure, volume, and order-flow confirmation before entering.
Entry Models
Abraham uses three main entry models. These models are not meant to be traded blindly. They only matter when higher-timeframe context, liquidity, structure, volume, and order flow are already aligned.
Model 1: IFVG
The IFVG, or Inverse Fair Value Gap, is used after price takes liquidity and then shows a strong reaction in the opposite direction.
For Shorts
- Price takes liquidity above.
- Price sells off aggressively.
- Price closes below the IFVG area.
- Order flow supports the move down.
For Longs
- Price takes sell-side liquidity.
- Price reclaims with volume.
- Price closes above the IFVG area.
- Order flow supports the move up.
The IFVG by itself is not enough. Abraham specifically explains that IFVGs can fail often when they are not supported by order flow. The trader should require confirmation from Bookmap, the tape, volume, and structure. If the pattern appears without order-flow support, the trade should be skipped.
Model 2: Change in State of Delivery
The Change in State of Delivery model starts with an existing trend or directional move. Price reacts at an area, appears as if it may continue in the old direction, then manipulates with volume before breaking in the real direction.
The sequence usually looks like this: price reacts at a key area, manipulates traders into expecting one direction, breaks in the opposite direction, retests the broken area, and then continues once volume and order flow confirm the shift.
For Shorts
- Support fails.
- The failed area becomes resistance.
- Sellers take control.
For Longs
- Resistance breaks.
- The broken area becomes support.
- Buyers take control.
This model is focused on identifying when control shifts from one side of the market to the other.
Model 3: Break and Retest Continuation
Use this when the move has already started and you want continuation, not reversal.
The Sequence
- Price breaks a prior high or low with displacement.
- A fair value gap helps carry the move.
- Price retests the broken area.
- The retest closes back in the continuation direction.
- Order flow supports the continuation.
This setup is useful because the trader is not trying to catch the exact turning point. Instead, the goal is to join an existing move after the market has already shown intent.
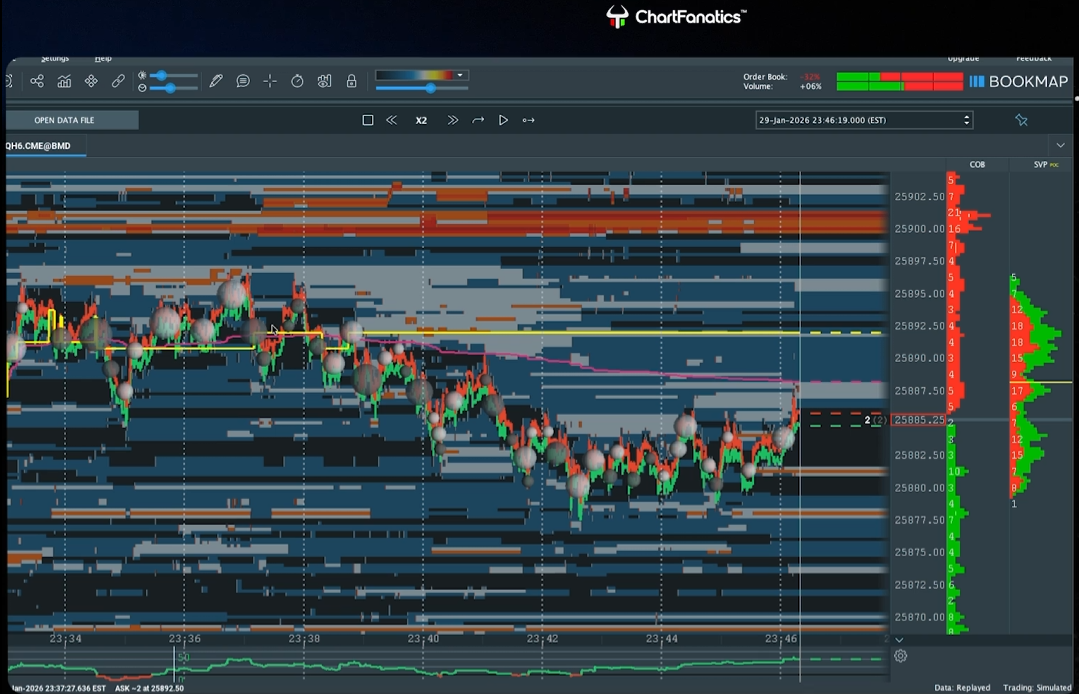
Order-Flow Confirmation
Bookmap is not a decoration in this strategy. It is part of the decision-making process. Abraham uses Bookmap to confirm whether buyers or sellers are actually in control.
What to Watch
- Passive liquidity on the heatmap.
- Aggressive market orders on the tape and dots.
- Whether buyers or sellers are actually in control.
- Whether POC and VWAP are acting like support or resistance.
Signs of Weakness
- Heavy buying at a high with no follow-through.
- Heavy selling at a low with no follow-through.
- A level that keeps absorbing aggression without giving way.
Signs of Strength
- Aggressive volume pushing through a level.
- A break that holds.
- POC or VWAP holding in favor of the intended direction.
The important thing is this: liquidity can attract price, but aggression moves price.
Risk Rules
Stop Placement
Stops should be placed around the structure that proves the trade idea wrong.
- For shorts, the stop usually belongs above the swept high or above the structure that invalidates the bearish idea.
- For longs, the stop usually belongs below the swept low or below the structure that invalidates the bullish idea.
If POC or VWAP reclaims against the trade, the thesis may be weakening. If the setup never triggers, the trade should not be forced.
Positioning Rules
Risk should stay tight enough for a scalp, and position size should match the stop distance. Abraham avoids entering late because if the move has already run too far, the risk-to-reward may no longer make sense.
The trader should not chase price. If the move has already left without giving a clean entry, it is better to let it go.
Targets and Management
The goal is usually a quick payout, but clean setups can be given more room. In choppy or uncertain conditions, Abraham often uses a conservative target around 1:2. When the market is cleaner and order flow strongly supports the move, the trade can be held toward the next liquidity pool or reaction area.
Typical target areas include:
- Opposing liquidity
- Prior highs and lows
- Fair value zones
- Nearby reaction areas
Trade management is based heavily on order flow. If POC and VWAP continue supporting the move, Abraham is more willing to let the trade work. If the session is clean, the trade may deserve more room. If the market feels manipulated, balanced, or messy, expectations should be reduced.
If aggressive volume flips against the position, or if buyers or sellers lose control, the trade can be cut or reduced.
No-Trade Rules
A setup should be avoided when higher-timeframe context and lower-timeframe structure do not agree. The trader should also stay away when the market is balanced, no side has control, or price has not taken meaningful liquidity.
Do not trade when:
- The entry pattern appears but order flow does not confirm
- The entry comes too late
- Risk cannot be clearly defined
- POC and VWAP are working against the idea
- Volume does not support the trade direction
Patience is a major part of this strategy. Abraham repeatedly waits when the market does not give enough confirmation.
Trade Breakdown
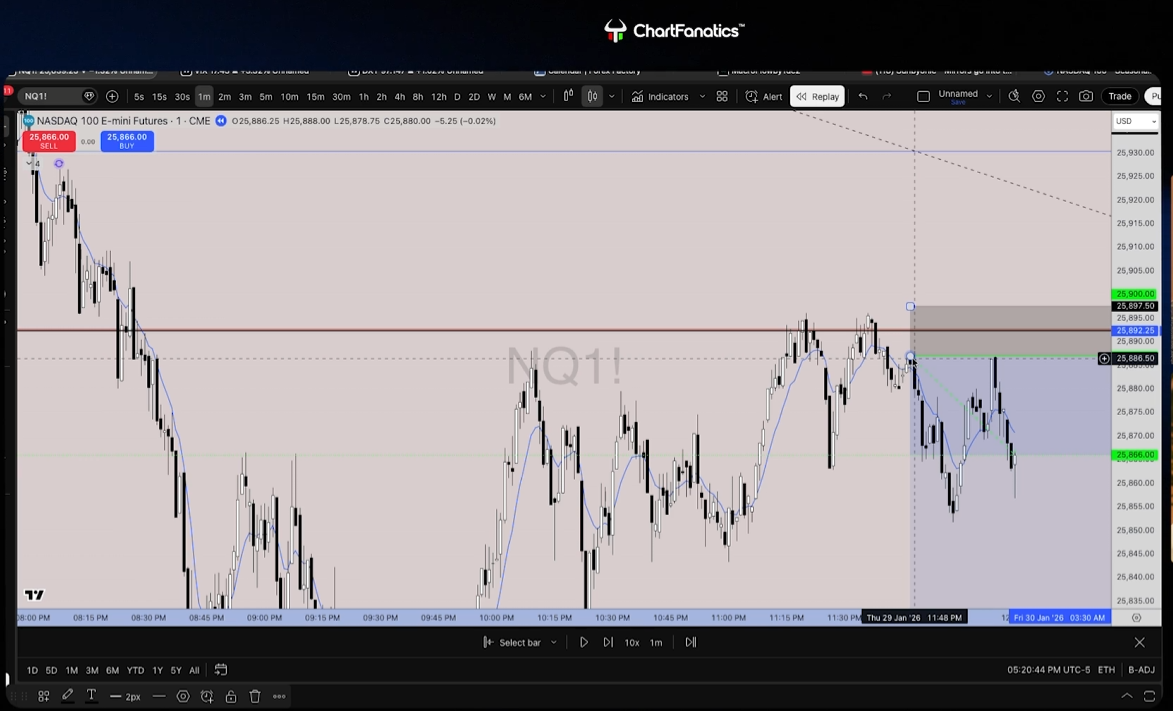
Bearish Example
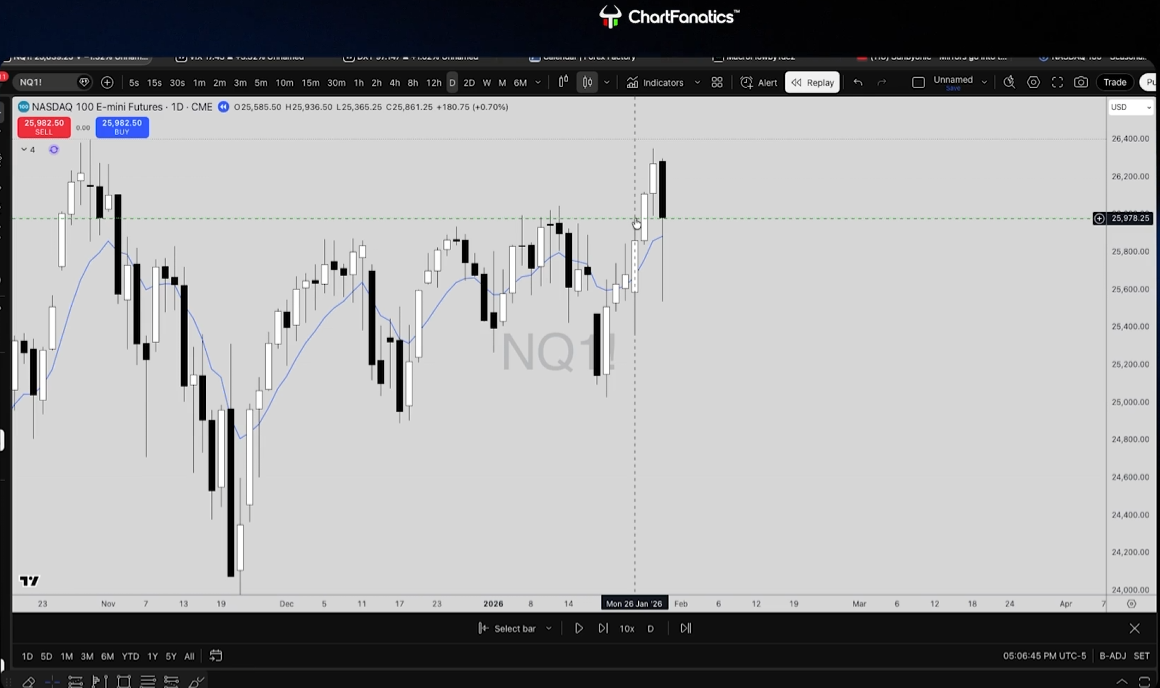
The higher time frame suggested a bearish pullback after external liquidity had already been taken.
Equal lows below became the downside target.
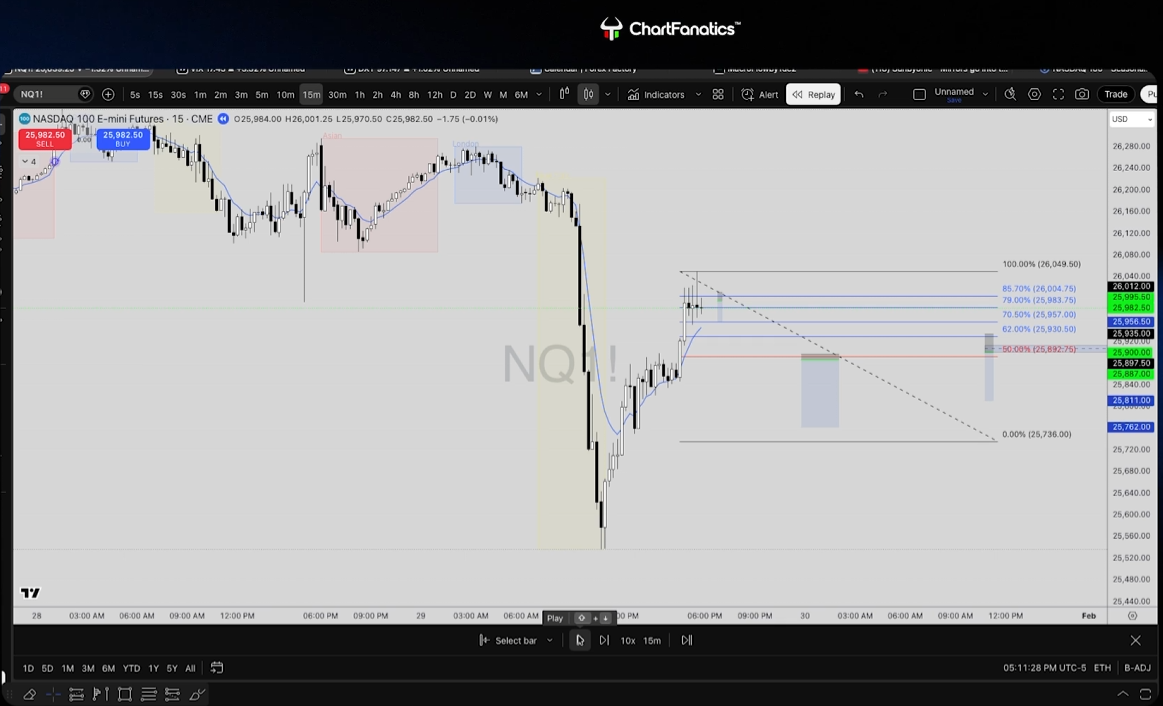
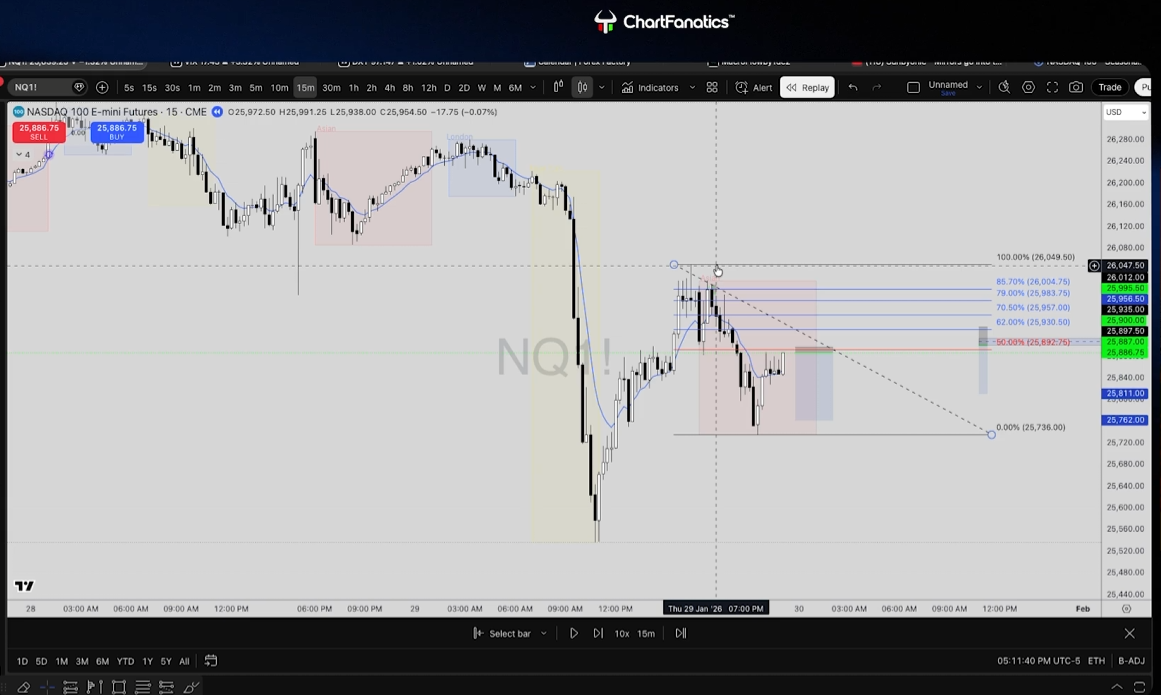
On the 15-Minute chart, price showed bearish displacement with volume. The same area continued acting as resistance during both Asia and New York, which helped support the short idea.
On the micro timeframe, price ran liquidity above the high, failed to continue, and formed either an IFVG or a structural shift. Bookmap confirmed the idea because buyers were losing control of the Point of Control, and selling volume began supporting the move lower.
The short entry came after the retest confirmed the idea. The stop belonged above the swept high or above the structure that invalidated the setup. The target was downside liquidity and nearby reaction areas.
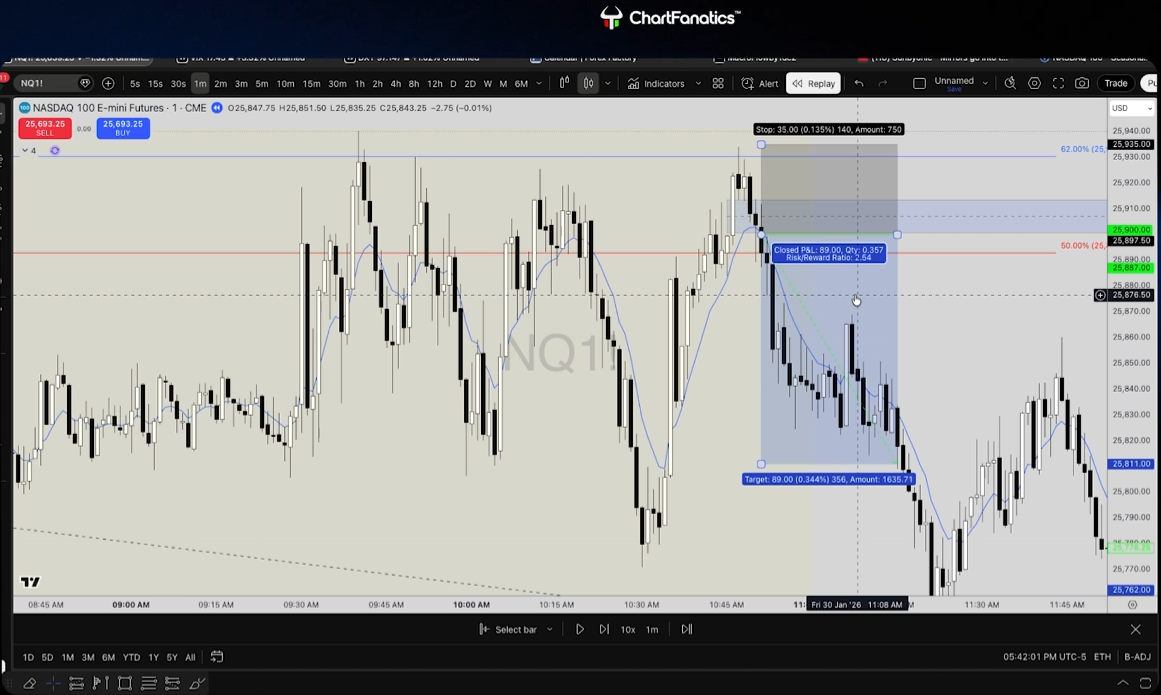
In the Asia example, the trade could run farther because the context was cleaner. In New York, Abraham treated the market more conservatively and focused closer to a 1:2 target because the conditions were more manipulated and balanced.
What Made the Trade Work
• Liquidity was taken first.
• Structure shifted.
• Volume supported the move.
• Bookmap confirmed that buyers were losing control.
• POC and VWAP were not supporting the other side.
Asia Continuation Example
• The higher time frame and secondary structure still supported the short idea.
• The setup formed during Asia, where Nasdaq can move cleaner when the context is aligned.
• Price rejected the same key resistance area and could not close with enough volume above it.
• On the 1-minute chart, price tried to push higher, failed, broke below the support area, and retested it from underneath.
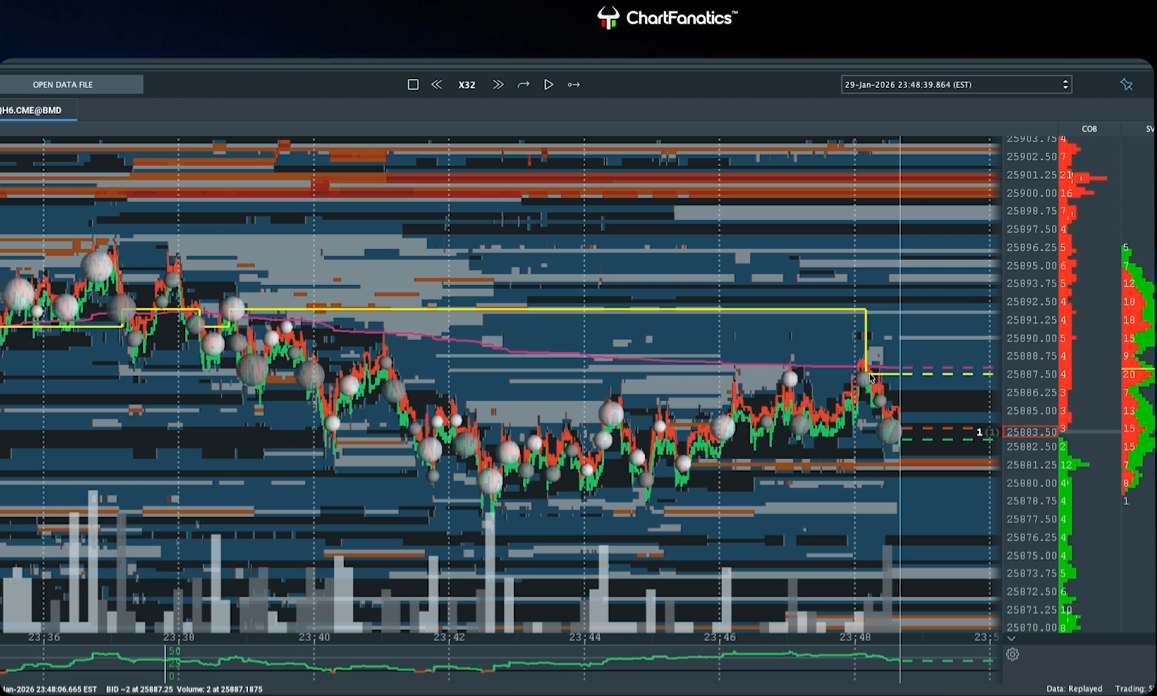
• Bookmap confirmed the idea when buyers lost power and the point of control shifted against them.
• The entry came after the retest, when selling volume supported the breakdown.
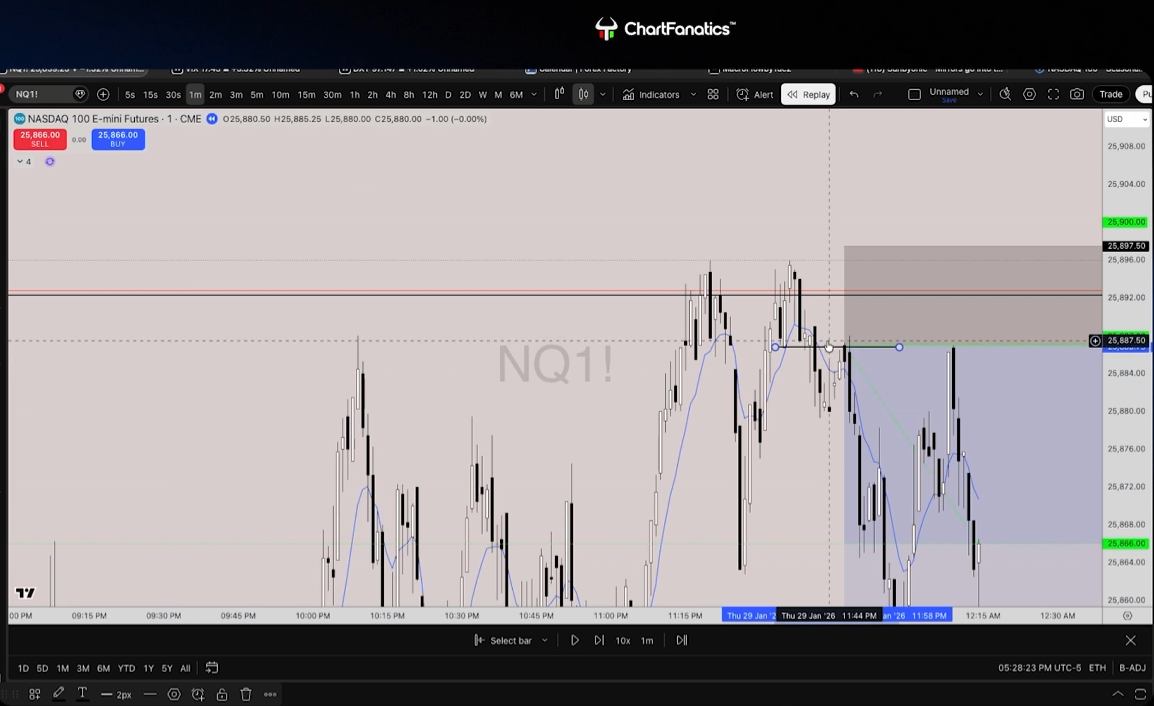
• POC and VWAP acted as protection while price continued lower.
• The target was placed before the next reaction zone, using downside liquidity and nearby fair value as the guide.
• Because the move was clean, the trade could be held for a larger reward instead of forcing a quick exit.
Key Lessons
- Start higher on the chart.
- Let liquidity get taken before you act.
- Use structure to narrow the idea.
- Use order flow to confirm the timing.
- If the trade does not give you confirmation, leave it alone.
- The setup is not the pattern by itself. The pattern only matters when the market has already shown intent.
Want to Learn More?
If you want to go beyond this one strategy and learn trading the right way, from the basics to advanced, Chart Academy is where to do it.
Chart Academy is the world's first free, all-in-one trading education platform, built to help traders learn real, practical skills from world-class traders. It offers in-depth masterclasses taught by professional traders across stocks, options, futures, forex, crypto, and trading psychology. Alongside the masterclasses, Chart Academy includes personalized learning paths, downloadable resources, and access to exclusive tools and rewards, all in one place. There are no subscriptions, no paywalls, and no credit card required. The goal is to make high-quality trading education accessible, practical, and easy to follow for traders of all levels.
Start learning for free on Chart Academy.


.svg)

.svg)