

Built For
Instruments: Stocks/ Futures
Trading Style: Day Trading
Strategy Overview
Steven Dux's small-cap short framework is a statistics-first playbook for shorting emotional low-float equity moves after the crowd has created enough demand, volume, and trapped positioning to make a reversal tradable. The framework is not one generic "short overextended stocks" idea. It is a family of related setups: the gap-up short, the bounce short, and the first red day.
The shared edge is selectivity. Dux starts with market cap, float, price, sector, pre-market volume, intraday volume, float rotation, and the amount of dollar volume trapped at key prices. Only after those filters line up does the chart pattern matter. The strategy works because small-cap runners are driven by supply, demand, crowd emotion, and liquidity constraints. When too much retail demand appears too quickly, when prior bagholders are waiting to sell near break-even, or when a multi-day runner reaches its likely exhaustion zone, the short side can become asymmetric.
The playbook is also built to avoid the common short-seller trap: being right eventually but too early. Dux repeatedly emphasizes that timing and sizing must change based on float, crowding, volume, and where the setup sits in the cycle. A low-float ticker with dense volume can keep squeezing long after it looks expensive. A crowded gapper can be a bad same-day short but a good short the following day after volume dries up. A first red day can be a high-probability trade, but only after the runner has met strict multi-day criteria and the first red day is confirmed.
Built For
Instruments and Trading Style
This framework is built for U.S. small-cap equities, especially names with low market cap, low float, aggressive percentage moves, and heavy retail participation. It is short-biased and works best with borrow access, clean pre-market and intraday volume reads, float comparison, and an understanding of how prior holders may react when price returns toward old resistance.
Timeframes and Timing
The gap-up short is mainly an intraday setup after a stock gaps more than 100% and pushes after the open. Dux focuses heavily on the 9:30 to 11:30 window because a large share of the day's volume often trades early, then liquidity can slow down. The bounce short is usually a next-day or multi-day return into a prior resistance area where a large dollar block of trapped volume exists. The first red day is a multi-day runner setup: identify the parabolic advance, wait for the first red day to appear, then look to short the following red session rather than randomly fighting the move on the way up.
Tools and Skill Level
The playbook requires a scanner, reliable float and market-cap data, pre-market volume, intraday volume, historical daily charts, one-hour or 30-minute charts for volume-at-price context, and the ability to estimate full-day volume from pre-market volume. It is not a beginner short-selling system. The setup requires experience with halts, locates, liquidity, position sizing, slippage, and the risk that a low-float stock can move far beyond what looks rational.
Core Idea
The core idea is to short only when the small-cap runner has created a measurable imbalance between likely selling pressure and likely buying power.
In a gap-up short, the imbalance appears after a low-market-cap stock gaps more than 100%, pushes after the open, consolidates, then starts to lose momentum after enough early volume has already traded. In a bounce short, the imbalance appears when price returns toward a previous high-volume consolidation where a large dollar block of trapped holders is likely waiting to sell. In a first red day, the imbalance appears after a parabolic multi-day advance reaches a statistically meaningful exhaustion area and then confirms weakness with a red day.
Dux uses statistics to avoid emotional decision-making. If a setup occurs a known number of times per year, has a known approximate win rate, and has a known average fade, there is no need to chase every stock. The job is to wait for the specific version of the setup that matches the data.
How the Setup Is Built
Step 1: Filter the Universe
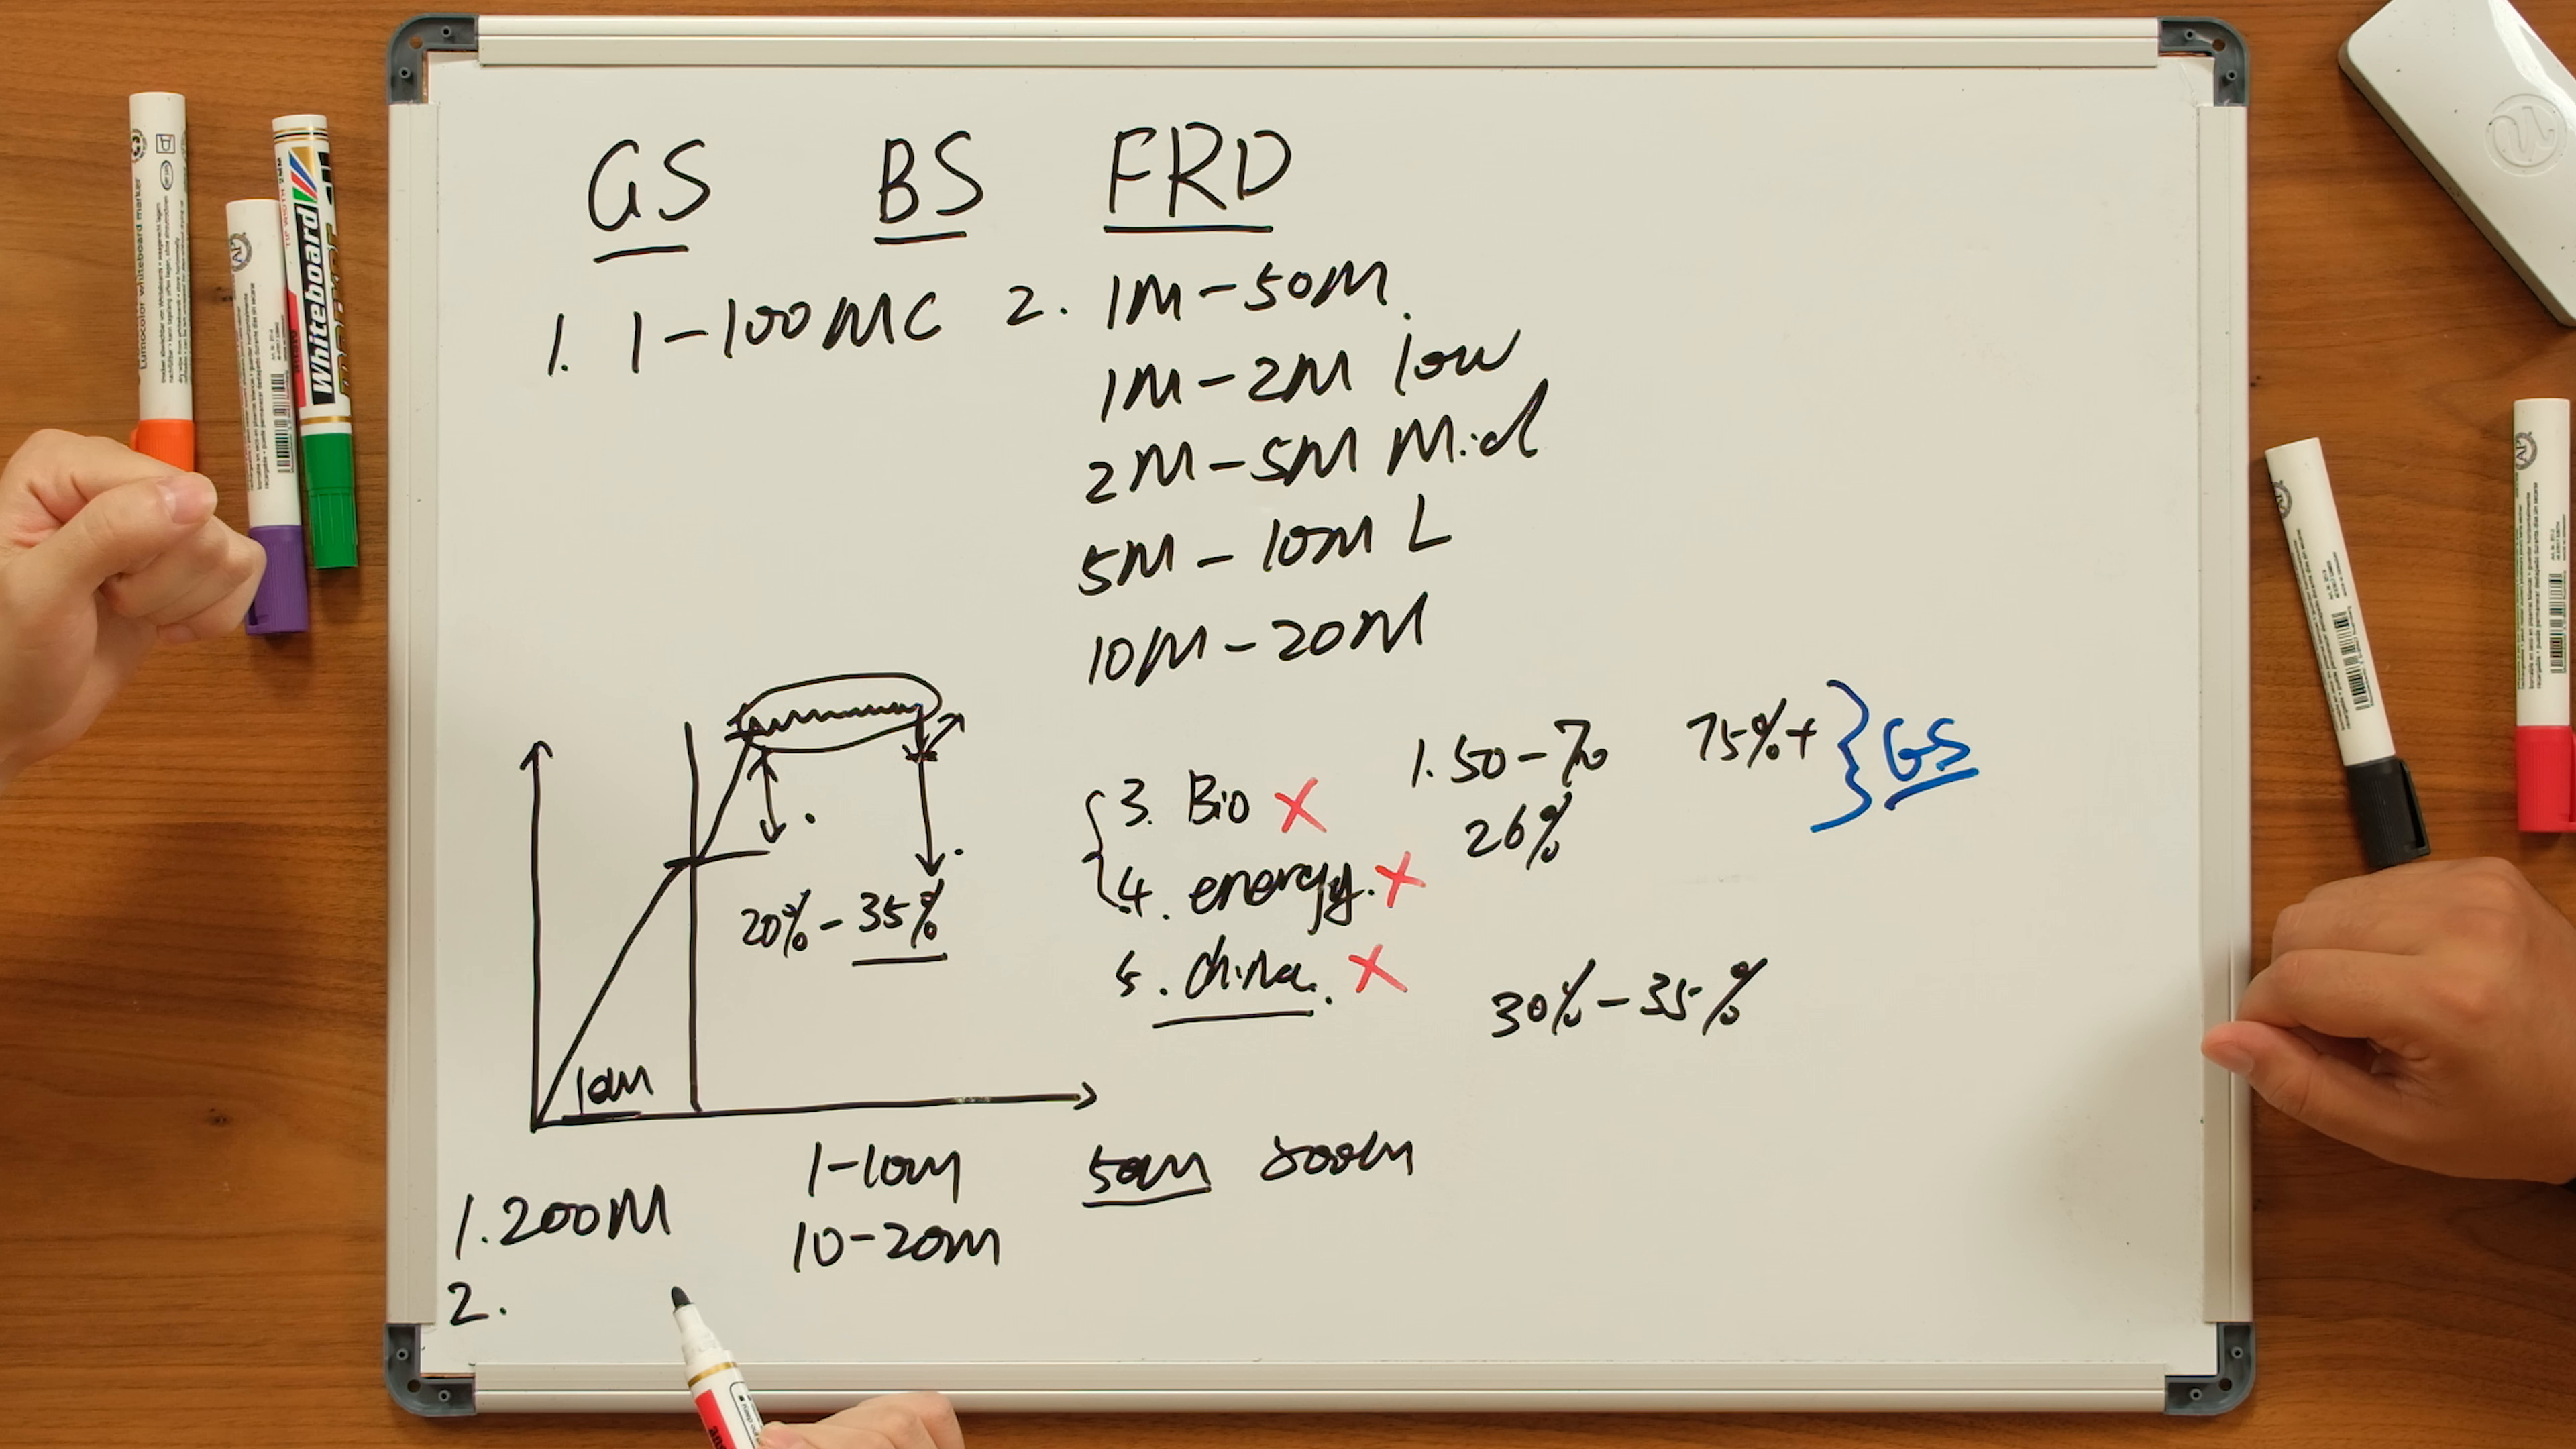
Start with small caps. Dux's baseline filters are initial market cap, float, price, volume, and sector. For the gap-up short and bounce short, the cleaner zone is generally initial market cap under $100 million, with bounce shorts and first red days able to extend toward roughly $200 million in some cases. The float should usually be below 50 million shares. A 1 to 2 million float is very low float, 2 to 5 million is mid float, and 5 to 10 million is larger but still within the small-cap short universe.
Price matters as well. Dux wants these tickers above $3 because sub-$3 stocks distort the statistics and can behave differently. Sector also matters. He avoids biotech, energy, and many thin Chinese tickers for these patterns because they can reduce the win rate, create halt risk, or produce extreme squeezes where there is no realistic exit.
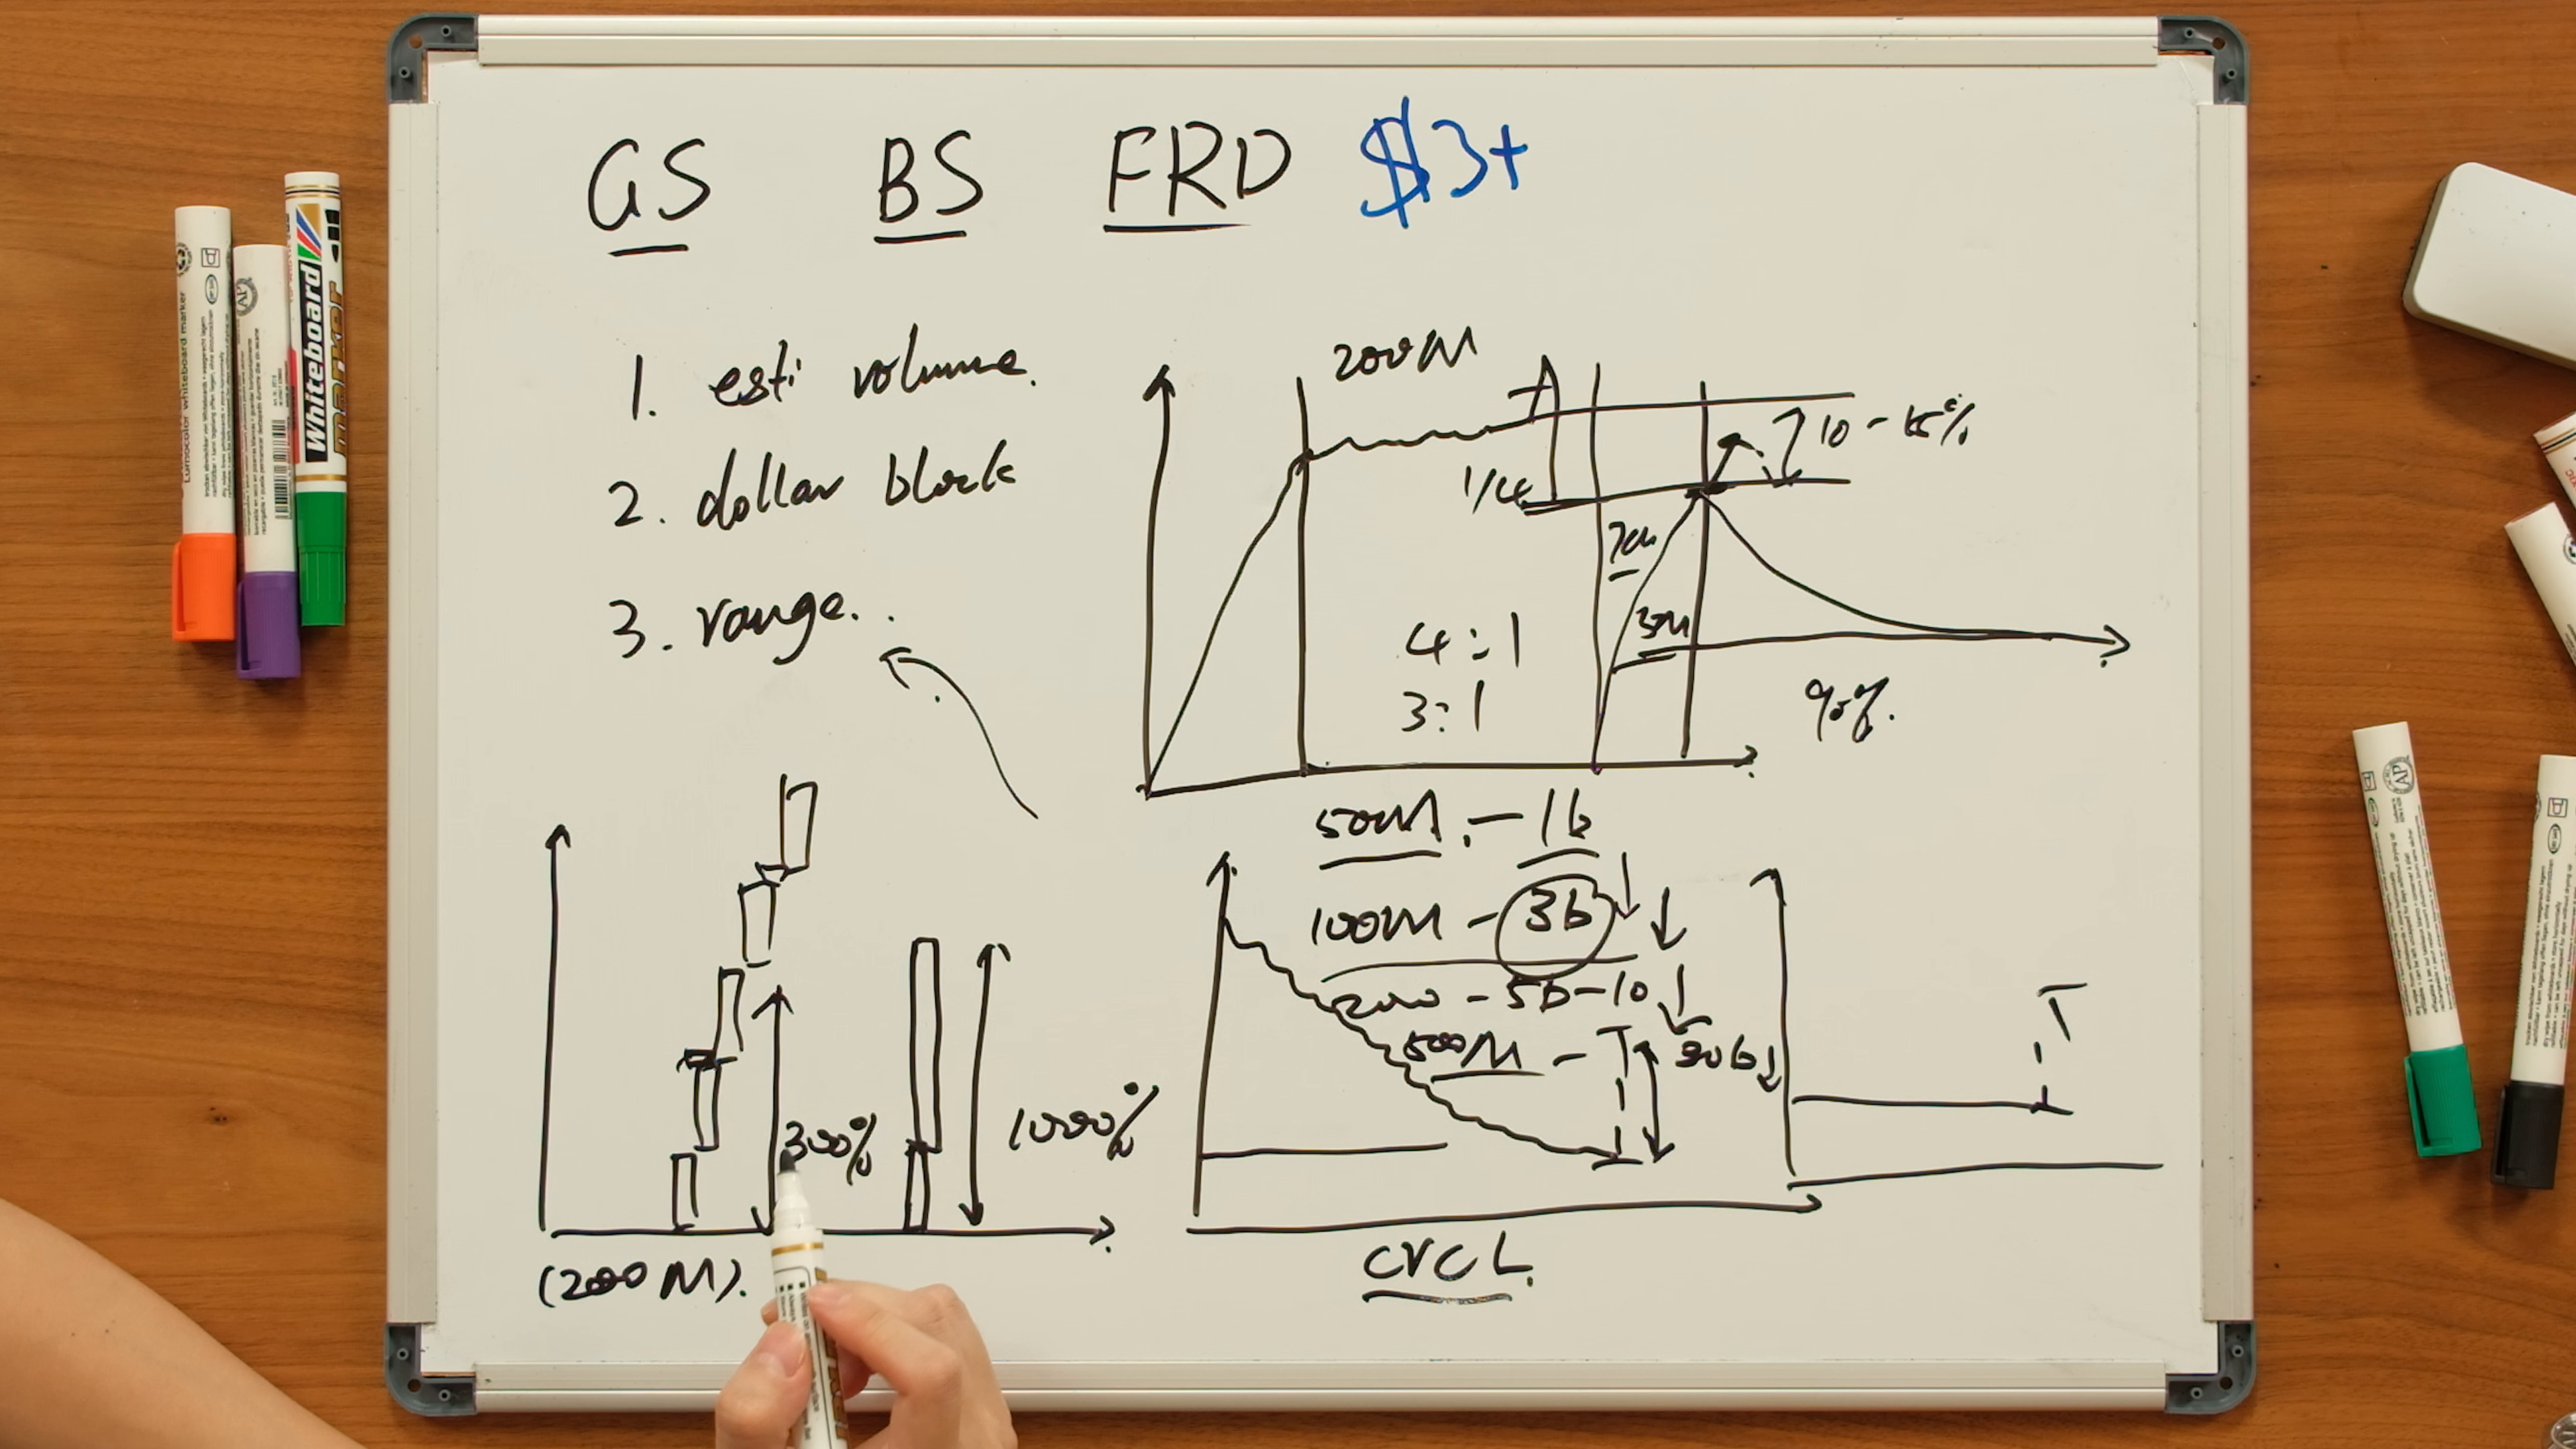
Step 2: Compare Volume Against Float and Market Cap
Volume is the main clue for whether the opportunity is tradable or too crowded. In a gap-up short, Dux estimates full-day volume from pre-market volume, often using a rough 1:5 to 1:10 relationship. If a ticker has already traded more than 50 million shares pre-market, the same-day gap-up short can become dangerous because total daily volume may expand into hundreds of millions of shares. That crowding can keep the stock alive longer than the short thesis expects.
Float rotation is another filter. If a very low-float stock has already rotated more than 15 times, the same-day short becomes less attractive and size should come down until a clearer momentum shift appears. A 700,000-float stock trading dense volume is not the same trade as a 7 million-float stock with moderate volume.
Step 3: Wait for the Correct Pattern Variant
After the filters are met, the correct entry model depends on the setup stage. A clean gap-up short waits for an opening push, consolidation, and first meaningful breakdown. A bounce short waits for price to return into the prior high-volume resistance area while the current day's volume is much lower than the original trapped volume. A first red day waits for a parabolic multi-day sequence and then uses the second day of weakness, not the first guess at the top, as the primary trade.
This is where the common mistake is treating all overextended charts the same way. In Dux's framework, the same ticker may move from a no-trade gapper into a bounce short later. A crowded gap-up day may not be worth shorting immediately, but if it gaps down the next day and volume dries up, the short opportunity can become cleaner.
Strategy Rules
Baseline Qualification Rules
The setup starts with small-cap structure. Prefer stocks with initial market cap under $100 million for gap-up shorts, under roughly $200 million for bounce shorts and many first red day candidates, float under 50 million shares, and price above $3. Remove biotech and energy names from the core playbook unless there is an extreme outlier condition. Avoid thin Chinese tickers when volume and level two liquidity create serious halt risk.
The move also needs enough extension. For the gap-up short, the stock should usually be up more than 100%. For the first red day, a three-day sequence should create at least about 300% range from the initial breakout. A two-day exception needs much larger extension, around 1,000%, because the runner has had less time to build the same emotional exhaustion.
Volume and Crowding Rules
Pre-market volume determines whether the setup is likely tradable immediately. If a gapper trades more than 50 million shares before the open, Dux treats the same-day gap-up short with caution because the stock may remain crowded and active after the open. If the float rotates more than 15 times, especially in a very low-float name, the reward on a same-day short may shrink and the danger increases.
For a normal gap-up short, Dux wants to see enough early volume to confirm interest, but not so much that the stock becomes a crowded squeeze machine. He estimates full-day volume, watches whether roughly 30% to 35% of expected volume has traded by late morning, then looks for consolidation and the first real momentum shift.
Sector and Safety Rules
Biotech names are excluded from the core playbook because Dux's tracking showed a meaningful drop in win rate and too much mental energy for too little net edge. Energy names are also avoided. Thin Chinese tickers are especially dangerous when intraday volume is under roughly 30 million and the level two is thin, because halts can create moves where shorts cannot exit.
These are not aesthetic filters. They are risk filters. A short setup can look technically attractive while the underlying category makes the expected value poor.
Entry Models
Gap-Up Short
The gap-up short begins with a stock up more than 100%, usually from a small initial market cap and float under 50 million. After the open, Dux tracks the opening push. On very low floats around 1 to 2 million shares, the average post-open push may be 30% to 35%. On larger small-cap floats around 5 to 10 million shares, the average push may be closer to 20% to 25%.
The entry is not the open. The cleaner version waits for the stock to push, consolidate for roughly an hour, and then show its first meaningful weakness between about 10:00 and 11:00. Dux may begin sizing into the consolidation and then add full size once the breakdown appears. The stop belongs above the consolidation high. The average risk he describes is around 7%, with average fade potential around 24% to 26%, giving a roughly 1:3.5 to 1:4 profile when the setup is clean.
If the stock is extremely crowded or very low float, the entry model changes. Under roughly 2 million float with heavy rotation, Dux wants a clear sign that momentum has shifted first, such as a major drop from the top followed by a bounce that can be shorted. With a higher float, such as 7 to 8 million shares, shorting against the pre-market high can be more reasonable because the squeeze risk is lower than in the ultra-low-float version.
Bounce Short
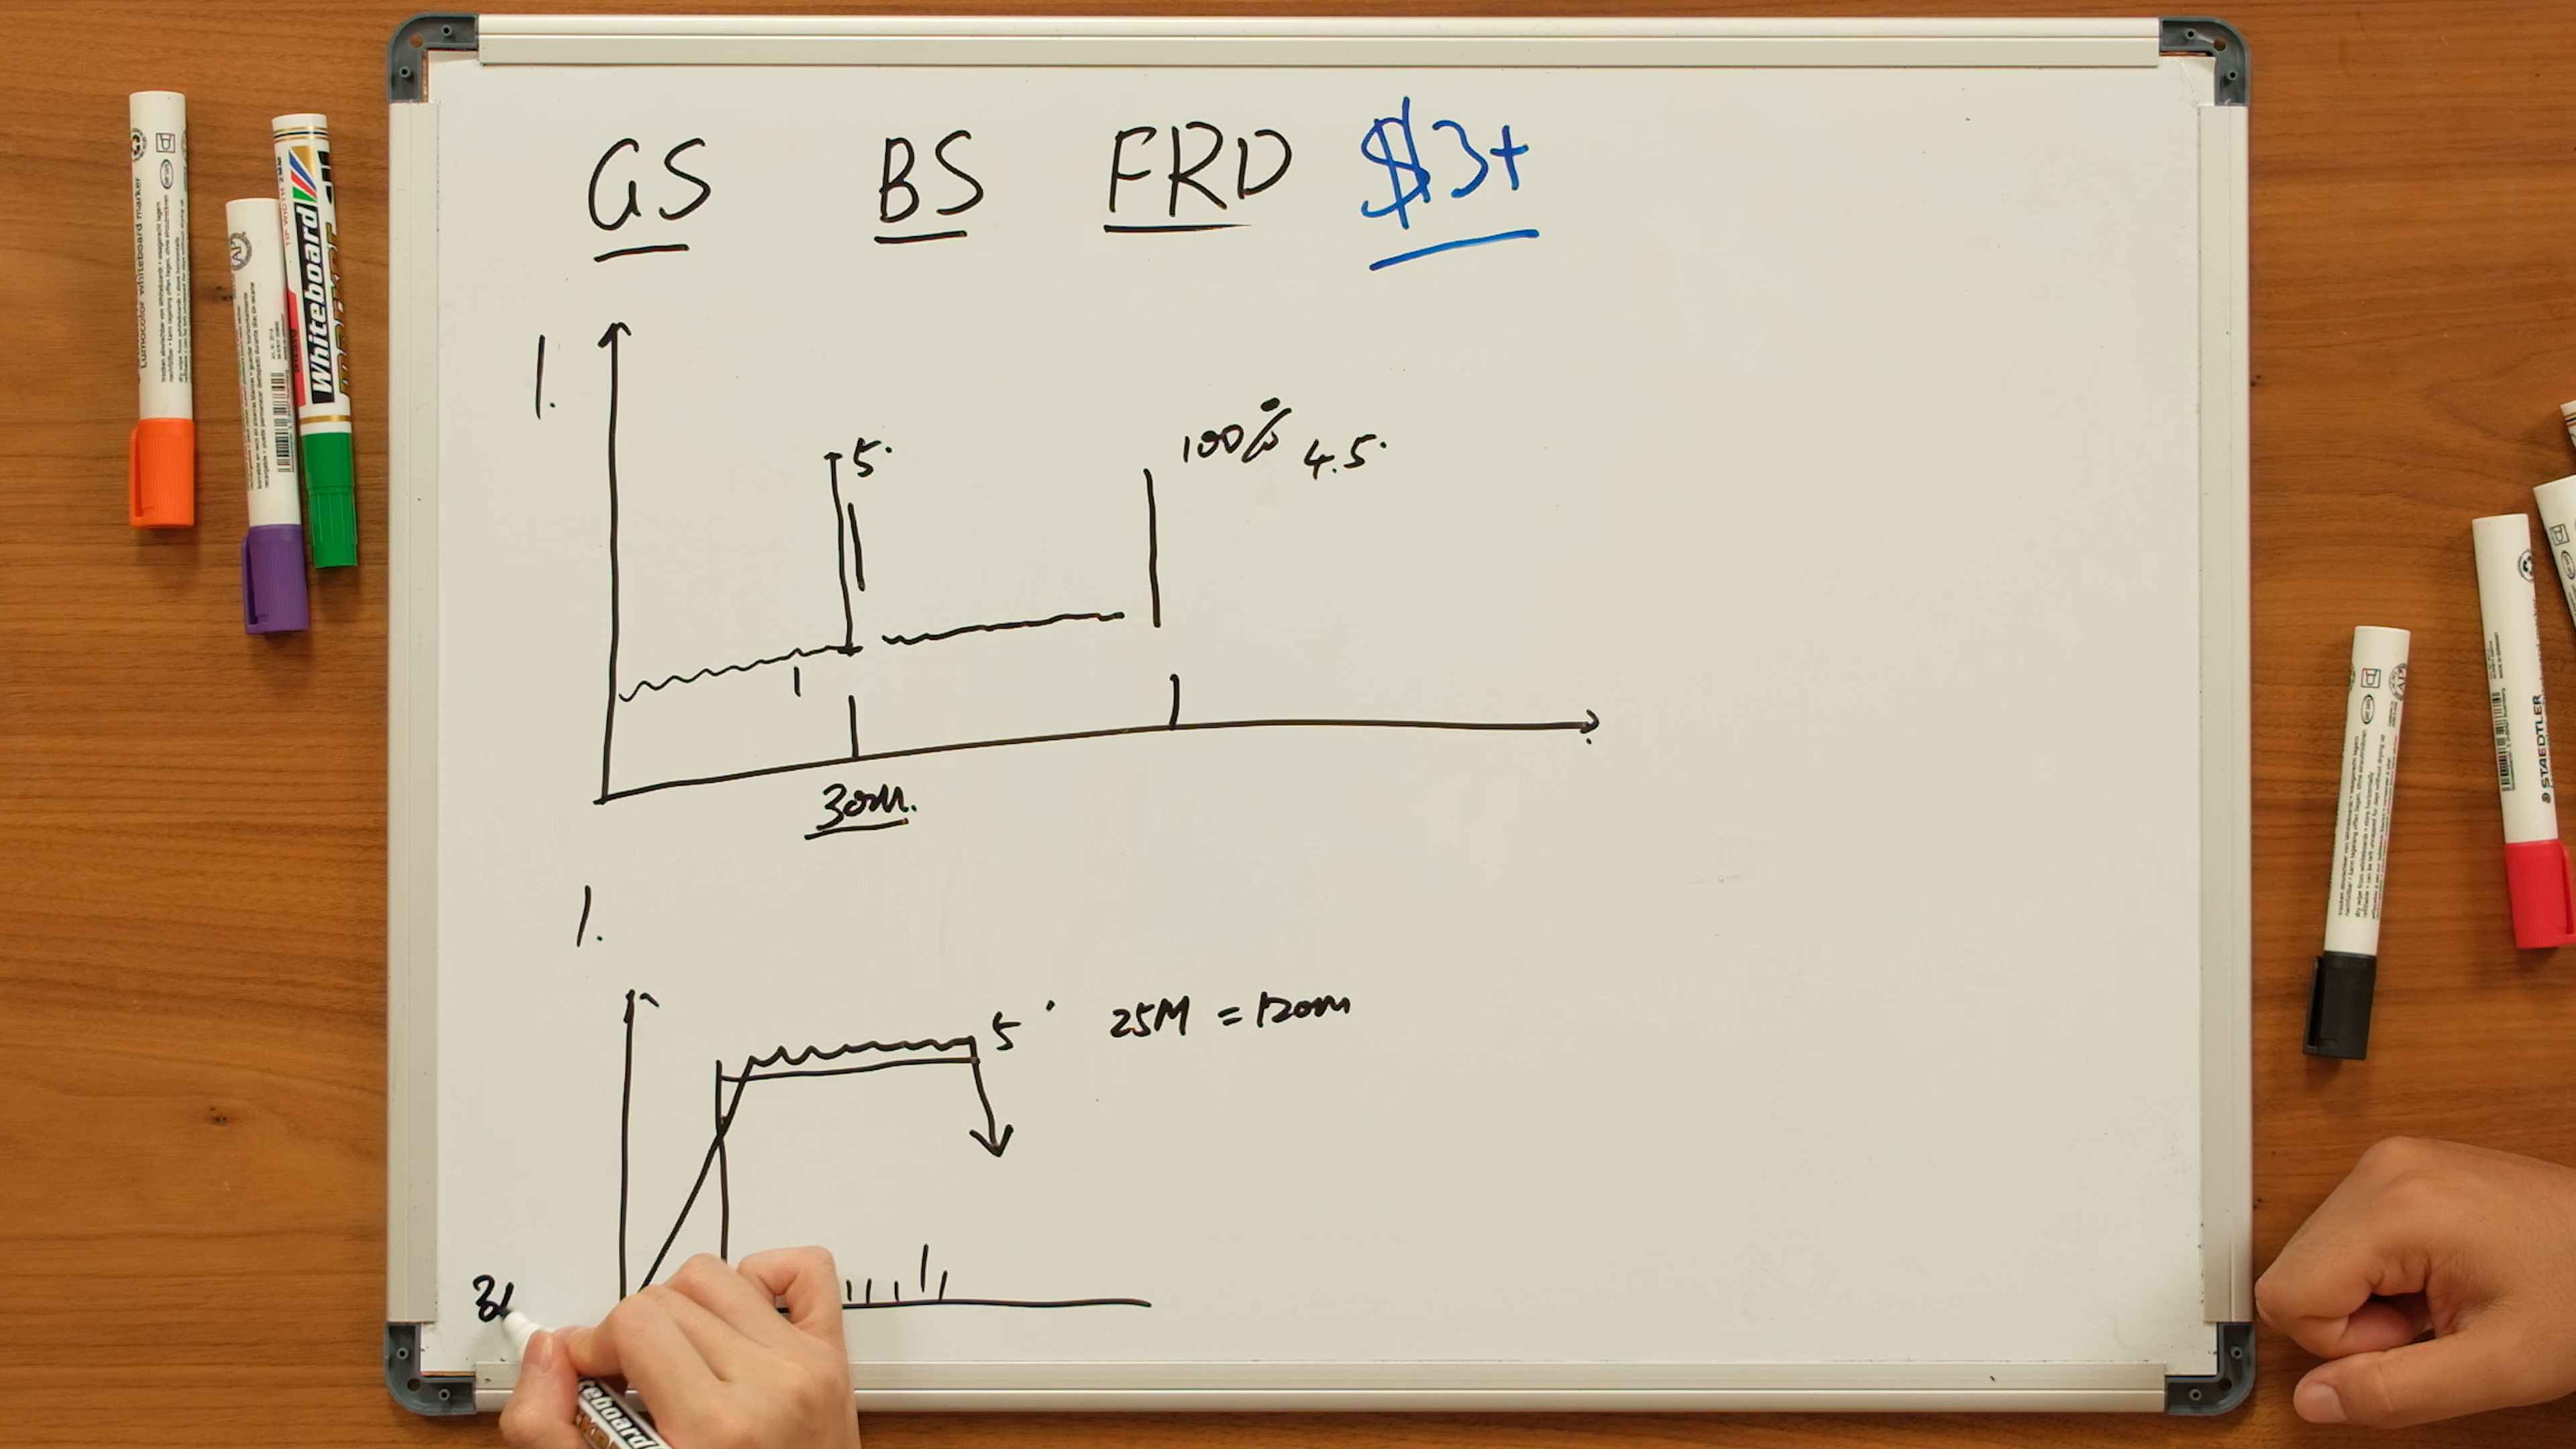
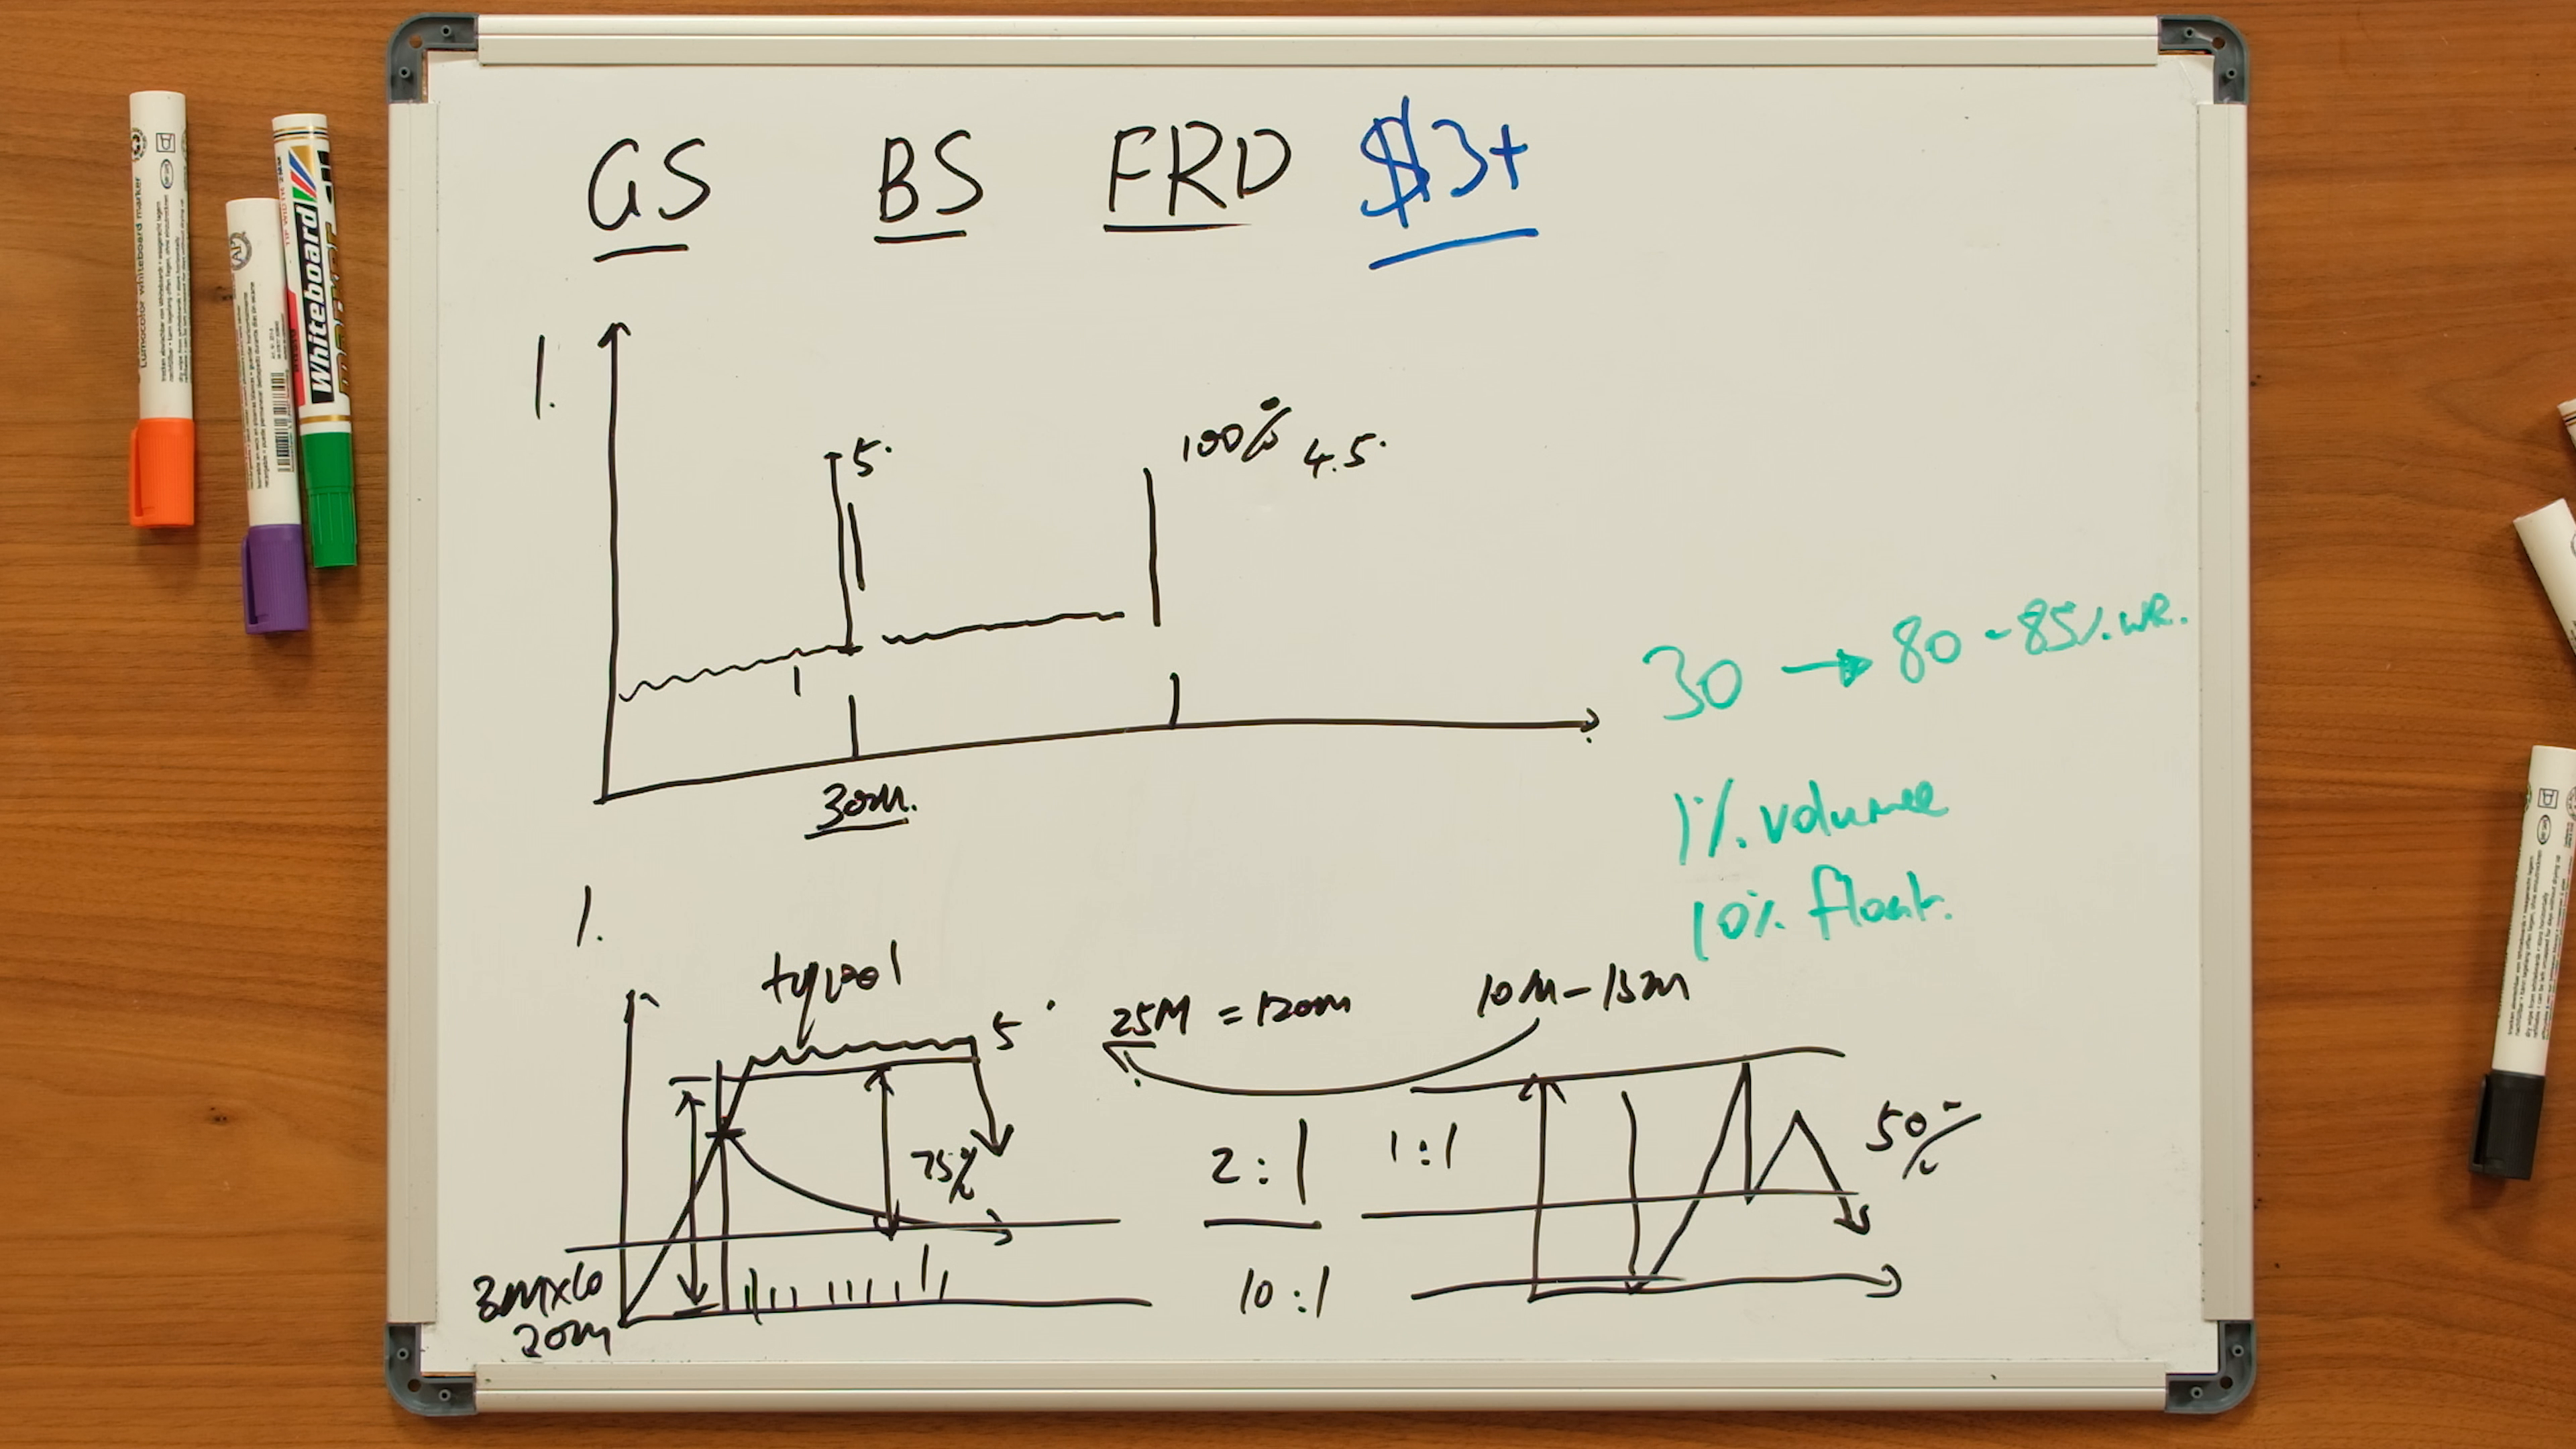
The bounce short starts on the historical chart. Look back over roughly a year and identify a prior day where the stock spiked, traded heavy volume, consolidated near a clear price, and then dumped. That prior consolidation matters because it represents trapped holders. If a stock traded 25 million shares around $5, that is roughly a $125 million block of trapped volume around that level.
When the stock later gaps or spikes back toward that area, current buying power is compared against the old trapped volume. If pre-market volume implies perhaps 10 to 15 million shares of current-day volume after adjusting for a weak open, but the old resistance area holds 25 million trapped shares, the ratio favors selling pressure. Dux likes the ratio to be at least favorable, such as 2:1, and he sizes more aggressively when the trapped-volume ratio is much stronger.
The entry is closest to the old consolidation or resistance area because that gives the best risk. If price gaps close to the trapped area with little pre-market volume, the setup can fail quickly after the open. If price climbs from the bottom toward the level during regular trading, the fade may require more patience and may produce a bounce before rolling over. The risk is built around the prior consolidation or resistance, and size must be adjusted so the risk does not become unmanageable if price pushes slightly through the level.
First Red Day
The first red day is the rarest and potentially largest model. It is not simply "short the first red candle." Dux wants a parabolic multi-day runner with consecutive green days, rising or at least dollar-adjusted rising volume, and enough range to justify the trade. The standard small-cap version needs at least three consecutive green days and roughly 300% range from the initial breakout. If there are only two days, the move needs much more extreme range, around 1,000%, to qualify.
A red day or flat day in the middle resets the count. The idea is to capture emotional chasing that builds day after day without a real reset. If the stock has already had red days that allowed participants to rebalance emotionally, the eventual short can be harder to predict.
Dux does not want to fight the runner too early. He calculates whether the stock is likely to reach the dollar-volume exhaustion area based on initial market cap, expected day range, and estimated volume. If the day is not likely to reach that exhaustion zone, the correct action is to leave it alone. Once the first red day appears, the cleaner short often comes the following day if it opens weak or stays red. He may begin with roughly one-fourth size near the open and add if the stock bounces into resistance. The risk is around the consolidation or spike area, and the expected reward must remain large enough after any gap down. If the first red day has already erased more than about 50% of the entire run, the remaining reward may not be worth the risk.
Risk Rules
Stop Placement
Stops are placed around the structure that invalidates the setup. For the gap-up short, the stop usually goes above the consolidation high after the opening push. For the bounce short, the stop is built around the prior resistance or consolidation area where trapped holders are expected to sell. For first red day, the stop is around the consolidation or spike area from the red-day failure zone.
The stop should not be chosen only because it creates a comfortable position size. Dux's framework starts with the real invalidation point, then sizes down until the risk is acceptable.
Size Limits
Position size is tied to float, volume, and win-rate quality. For bounce shorts, Dux gives two practical caps: avoid exceeding about 10% of the float and avoid exceeding about 1% of the volume. Oversizing can disrupt the supply-demand relationship that makes the pattern work, especially in low-float names.
When the float is very low, the stock is crowded, the price is barely above the $3 threshold, or the setup barely meets criteria, size should be reduced. When the volume ratio is strong, trapped supply is obvious, and the setup fits the clean version, size can increase. This sizing logic is part of the edge. The same chart pattern does not deserve the same risk in every ticker.
Avoiding Catastrophic Shorts
Do not short thin stocks where a halt can create a move that cannot be exited. Do not treat very low-float crowding as a normal fade. Do not size a first red day as if the top is guaranteed. Do not short into the highest-volume part of a squeeze without confirmation that momentum has shifted.
Dux's risk philosophy is that the account must survive being early. The framework is designed to reduce early entries by using statistics, but strict size control and a clear exit are still required if the structure fails.
Targets and Management
Gap-Up Short Targets
The target is based on average fade and the specific intraday structure. Dux describes an average fade around 26% from the intraday high for clean gap-up shorts. Since entries usually occur below the high after confirmation, practical target potential may be closer to 24% to 25%. The first target is often the breakdown continuation from the consolidation, with management based on whether volume continues to dry and trapped buyers begin to exit.
Bounce Short Targets
Bounce short targets depend on how price returned to resistance. If the stock gaps directly into the old trapped area with little current volume, it can fade quickly and deeply. If it climbs from the bottom toward resistance during regular hours, it may bounce and then fade. Dux describes one version fading around 75% of the move from the top and another version fading closer to 50%. The type of approach into resistance matters.
First Red Day Targets
First red day targets can be large, but the trade must still have room. If the first red day has already collapsed more than half the total run, the easy reward may be gone. When the trade is still early, the objective is to ride the unwind as buying demand disappears and prior momentum buyers exit. Large size should be covered along the way so the position gives liquidity back to the market rather than trapping itself.
No-Trade Rules
Avoid the trade when:
- The stock is biotech or energy and does not have an extreme outlier reason to override the filter.
- The stock is a thin Chinese ticker with low intraday volume and halt risk.
- Price is below $3.
- The gap-up short has more than 50 million shares traded pre-market and remains crowded after the open.
- Float rotation is above roughly 15 times and there is no clear momentum-shift signal.
- The stock has not moved enough to qualify: less than 100% gap for gap-up short, or insufficient range for first red day.
- The first red day sequence has a red or flat day in the middle, resetting the count.
- The first red day has already consumed more than about 50% of the whole run before the planned entry.
- The bounce short does not have a meaningful prior trapped-volume resistance area.
- Current-day volume can compete with or overwhelm the prior trapped-volume block.
- The stop would be so wide that the reward-to-risk no longer matches the playbook.
Trade Examples
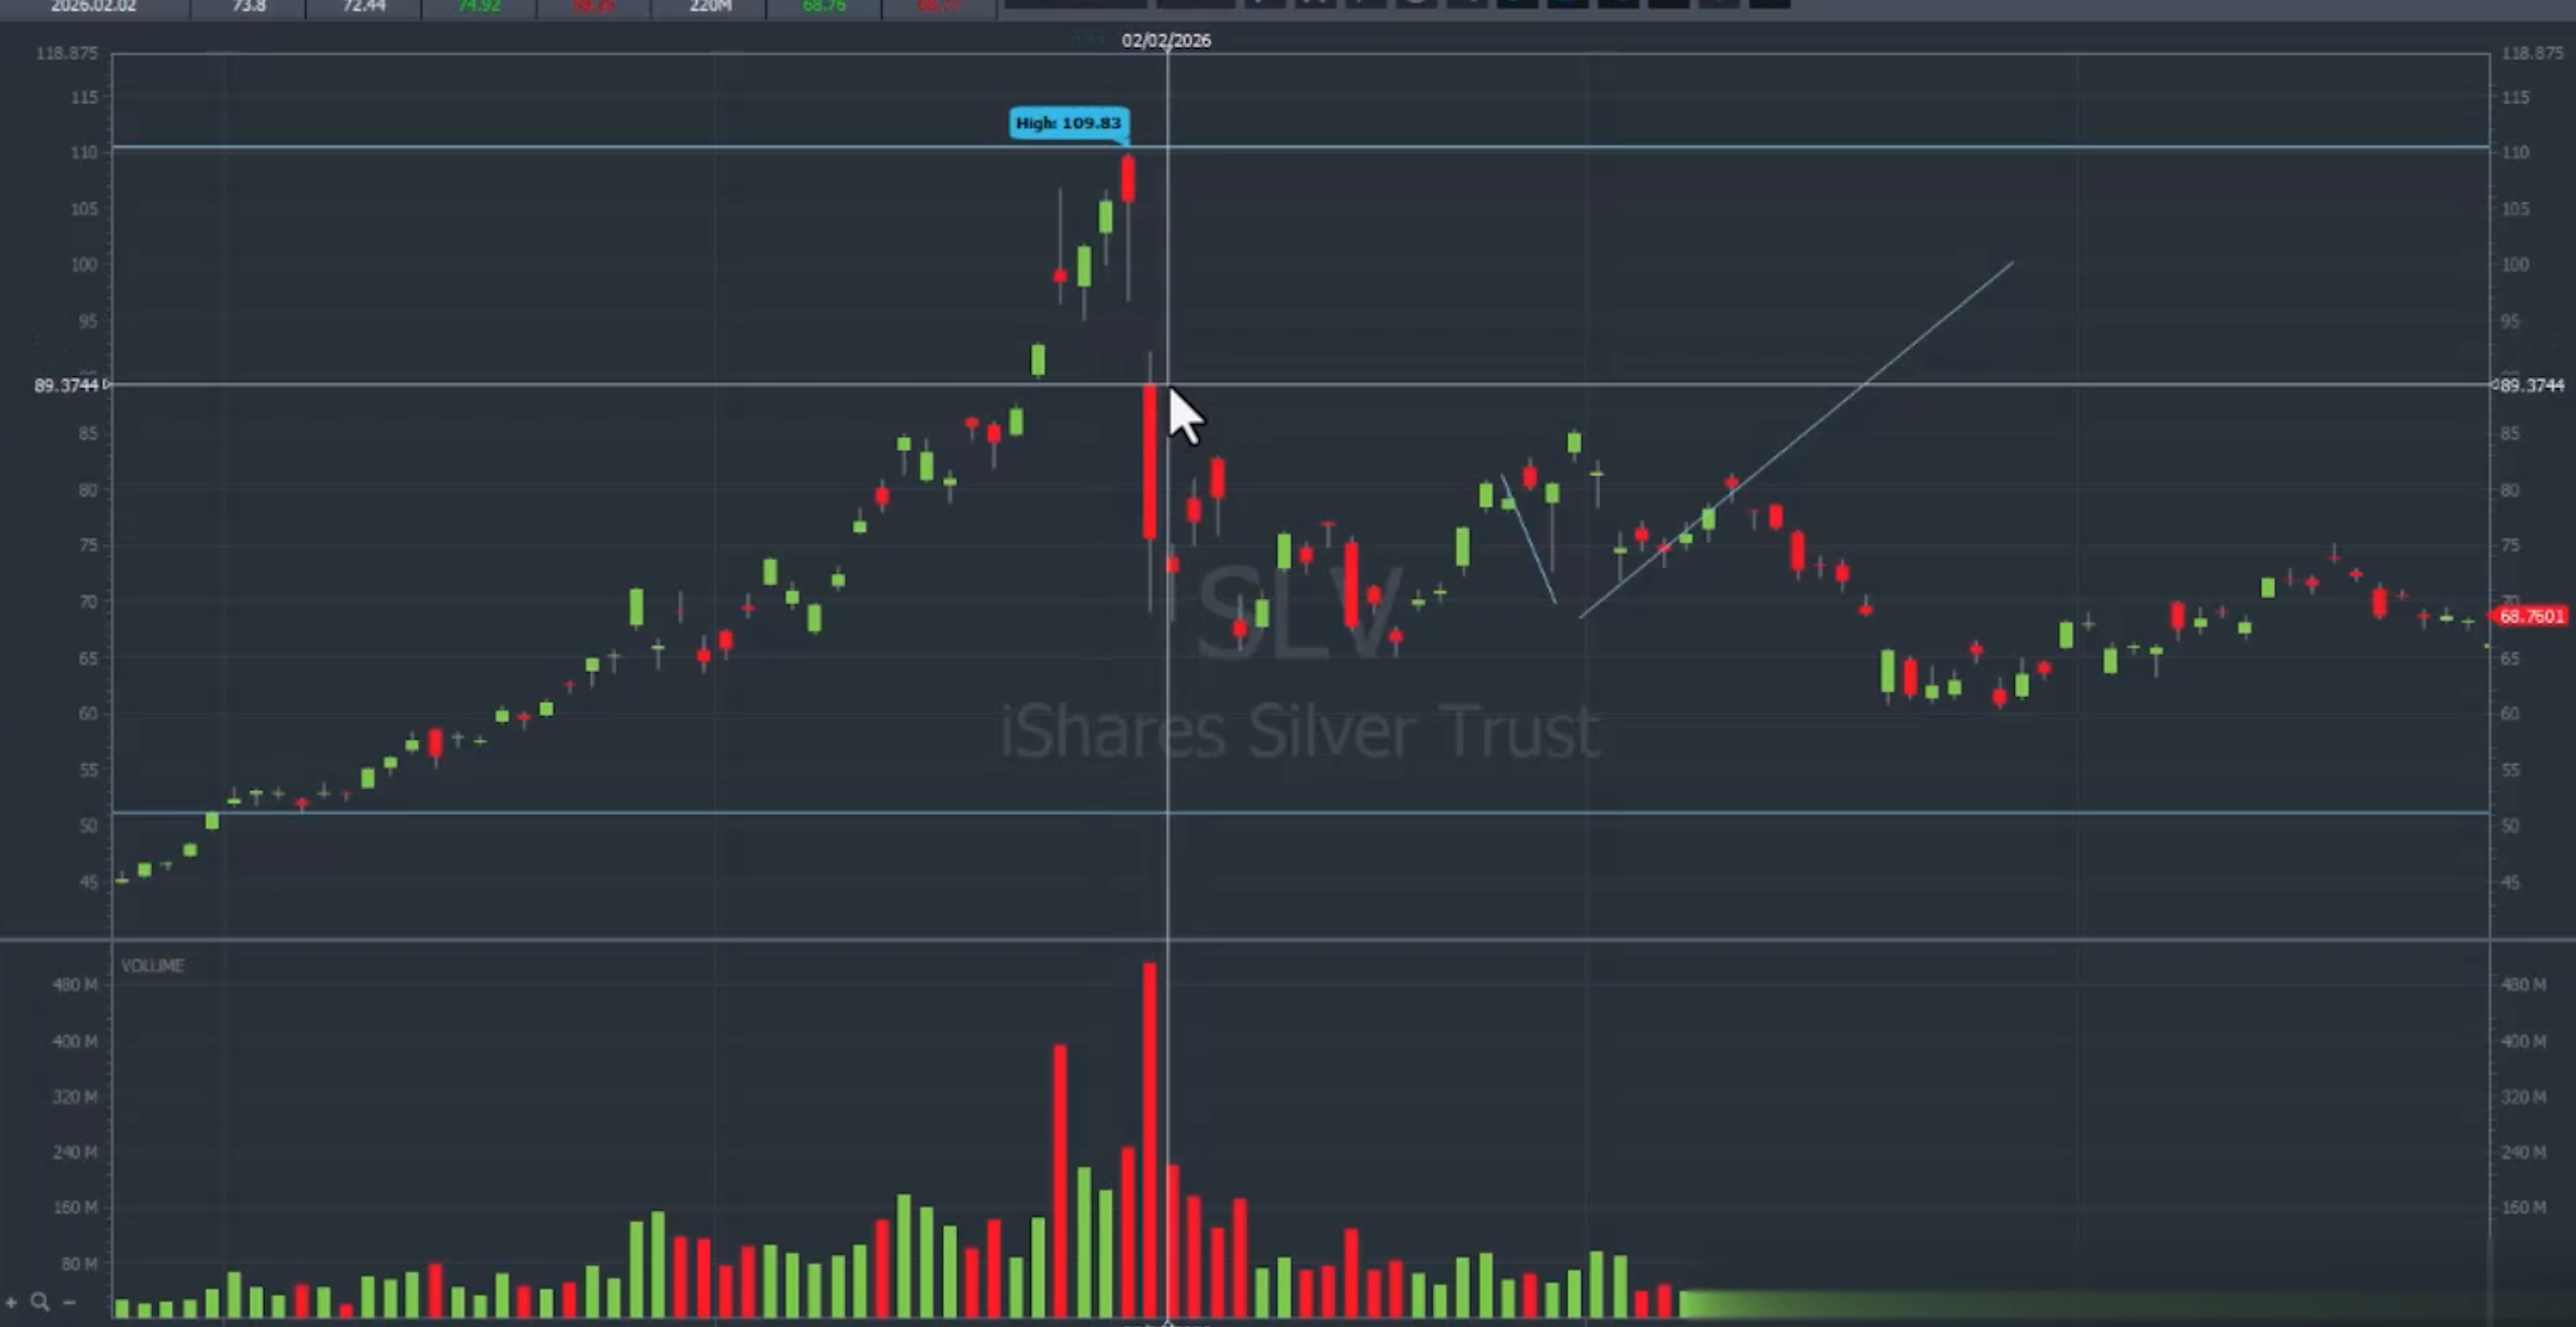
First Red Day Example: Silver-Style Parabolic Runner
Dux walks through a first red day example using a parabolic runner that produced multiple consecutive green days and then finally closed red. The key lesson is that the trade is not taken just because the chart looks extended. The setup needs a clean emotional sequence: at least three consecutive green days, expanding dollar volume, and enough range from the initial breakout to leave room for a meaningful fade.
In the example, the first red day closed weak and the following day opened down. Because the gap down had not already erased more than half of the total run, there was still room to short around the open area and target further unwind. Dux notes that a red day in the middle would reset the count, and that a first red day is cleaner when the following day confirms weakness rather than immediately reclaiming green.
The lesson is to stop fighting the entire way up. Wait for the red-day confirmation, make sure reward remains after the first drop, and build risk around the consolidation or spike area that should not reclaim if the unwind is real.
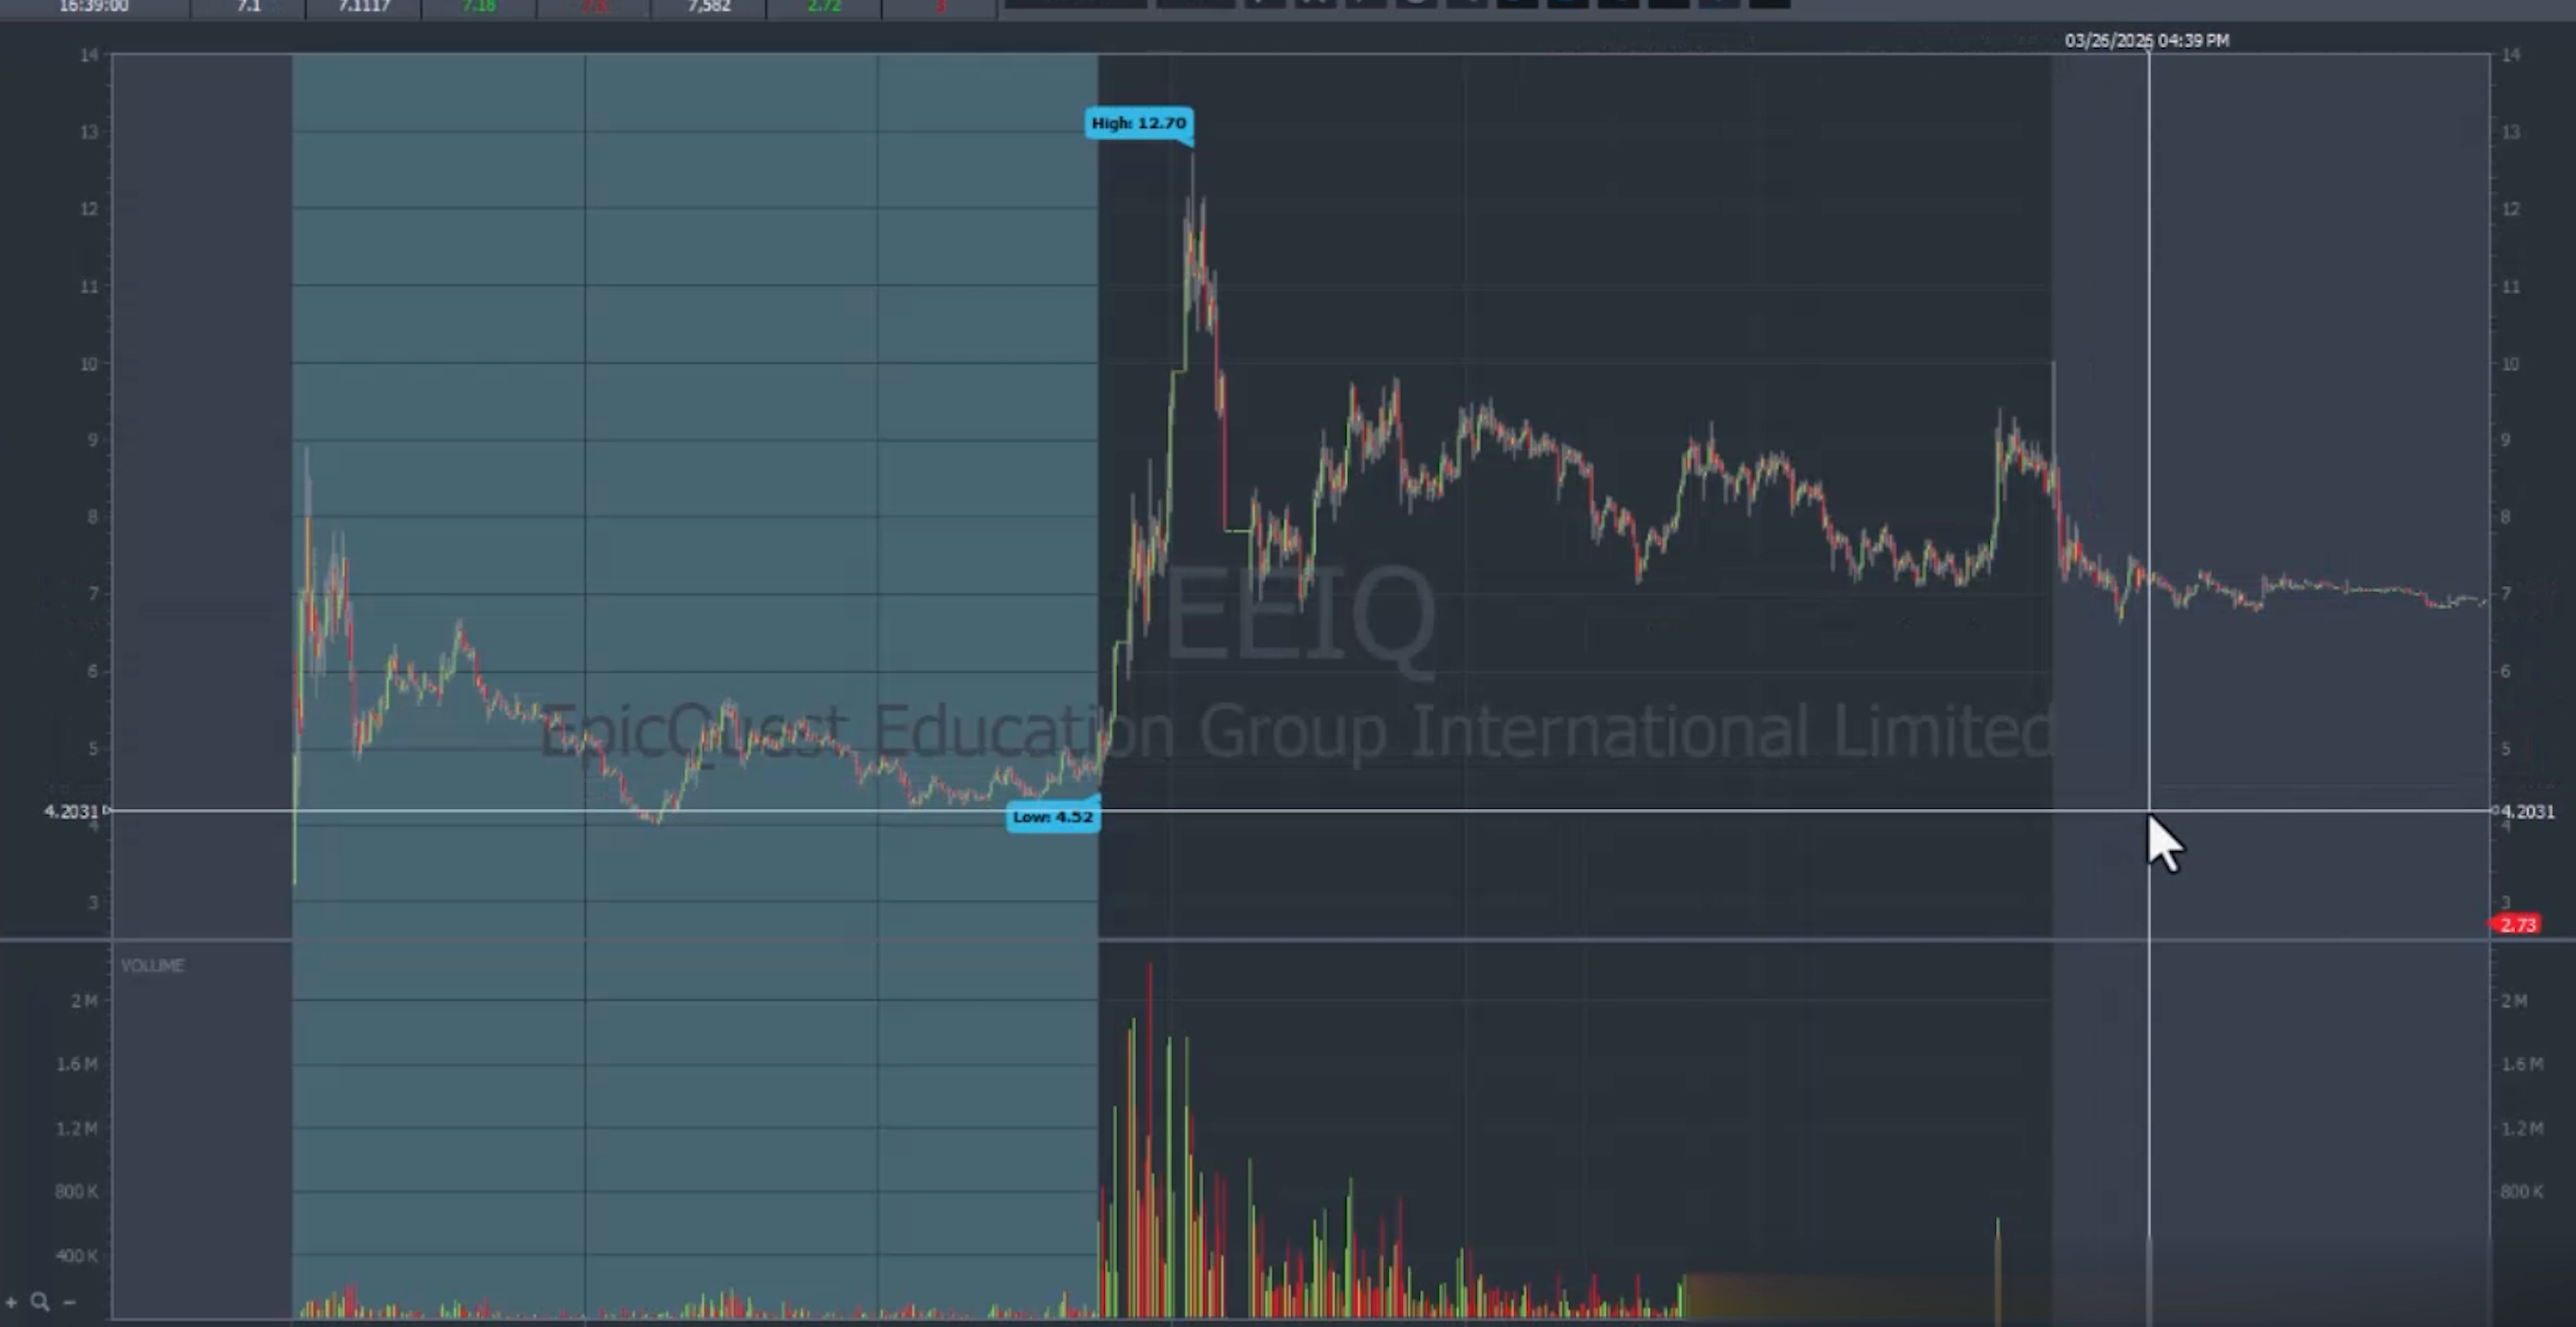
Gap-Up Short Example: Crowded Gapper Versus Tradable Gapper
Dux contrasts crowded gappers with cleaner gap-up shorts. A stock that trades more than 50 million shares pre-market can stay crowded after the open and squeeze through the consolidation instead of breaking down. In that case, the better trade may come the following day if the stock gaps down and volume dries up.
The cleaner version gaps more than 100%, pushes after the open, forms a consolidation, and then breaks down after enough early volume has already traded. On higher floats, the pre-market high can define the short-risk area. On ultra-low floats, execution should wait for a clearer signal that momentum has shifted, such as a large pull from the high followed by a bounce that can be shorted.
The lesson is that "gap up" is not enough. The crowding level, float rotation, pre-market volume, and timing of the breakdown decide whether the trade is live or should be skipped.
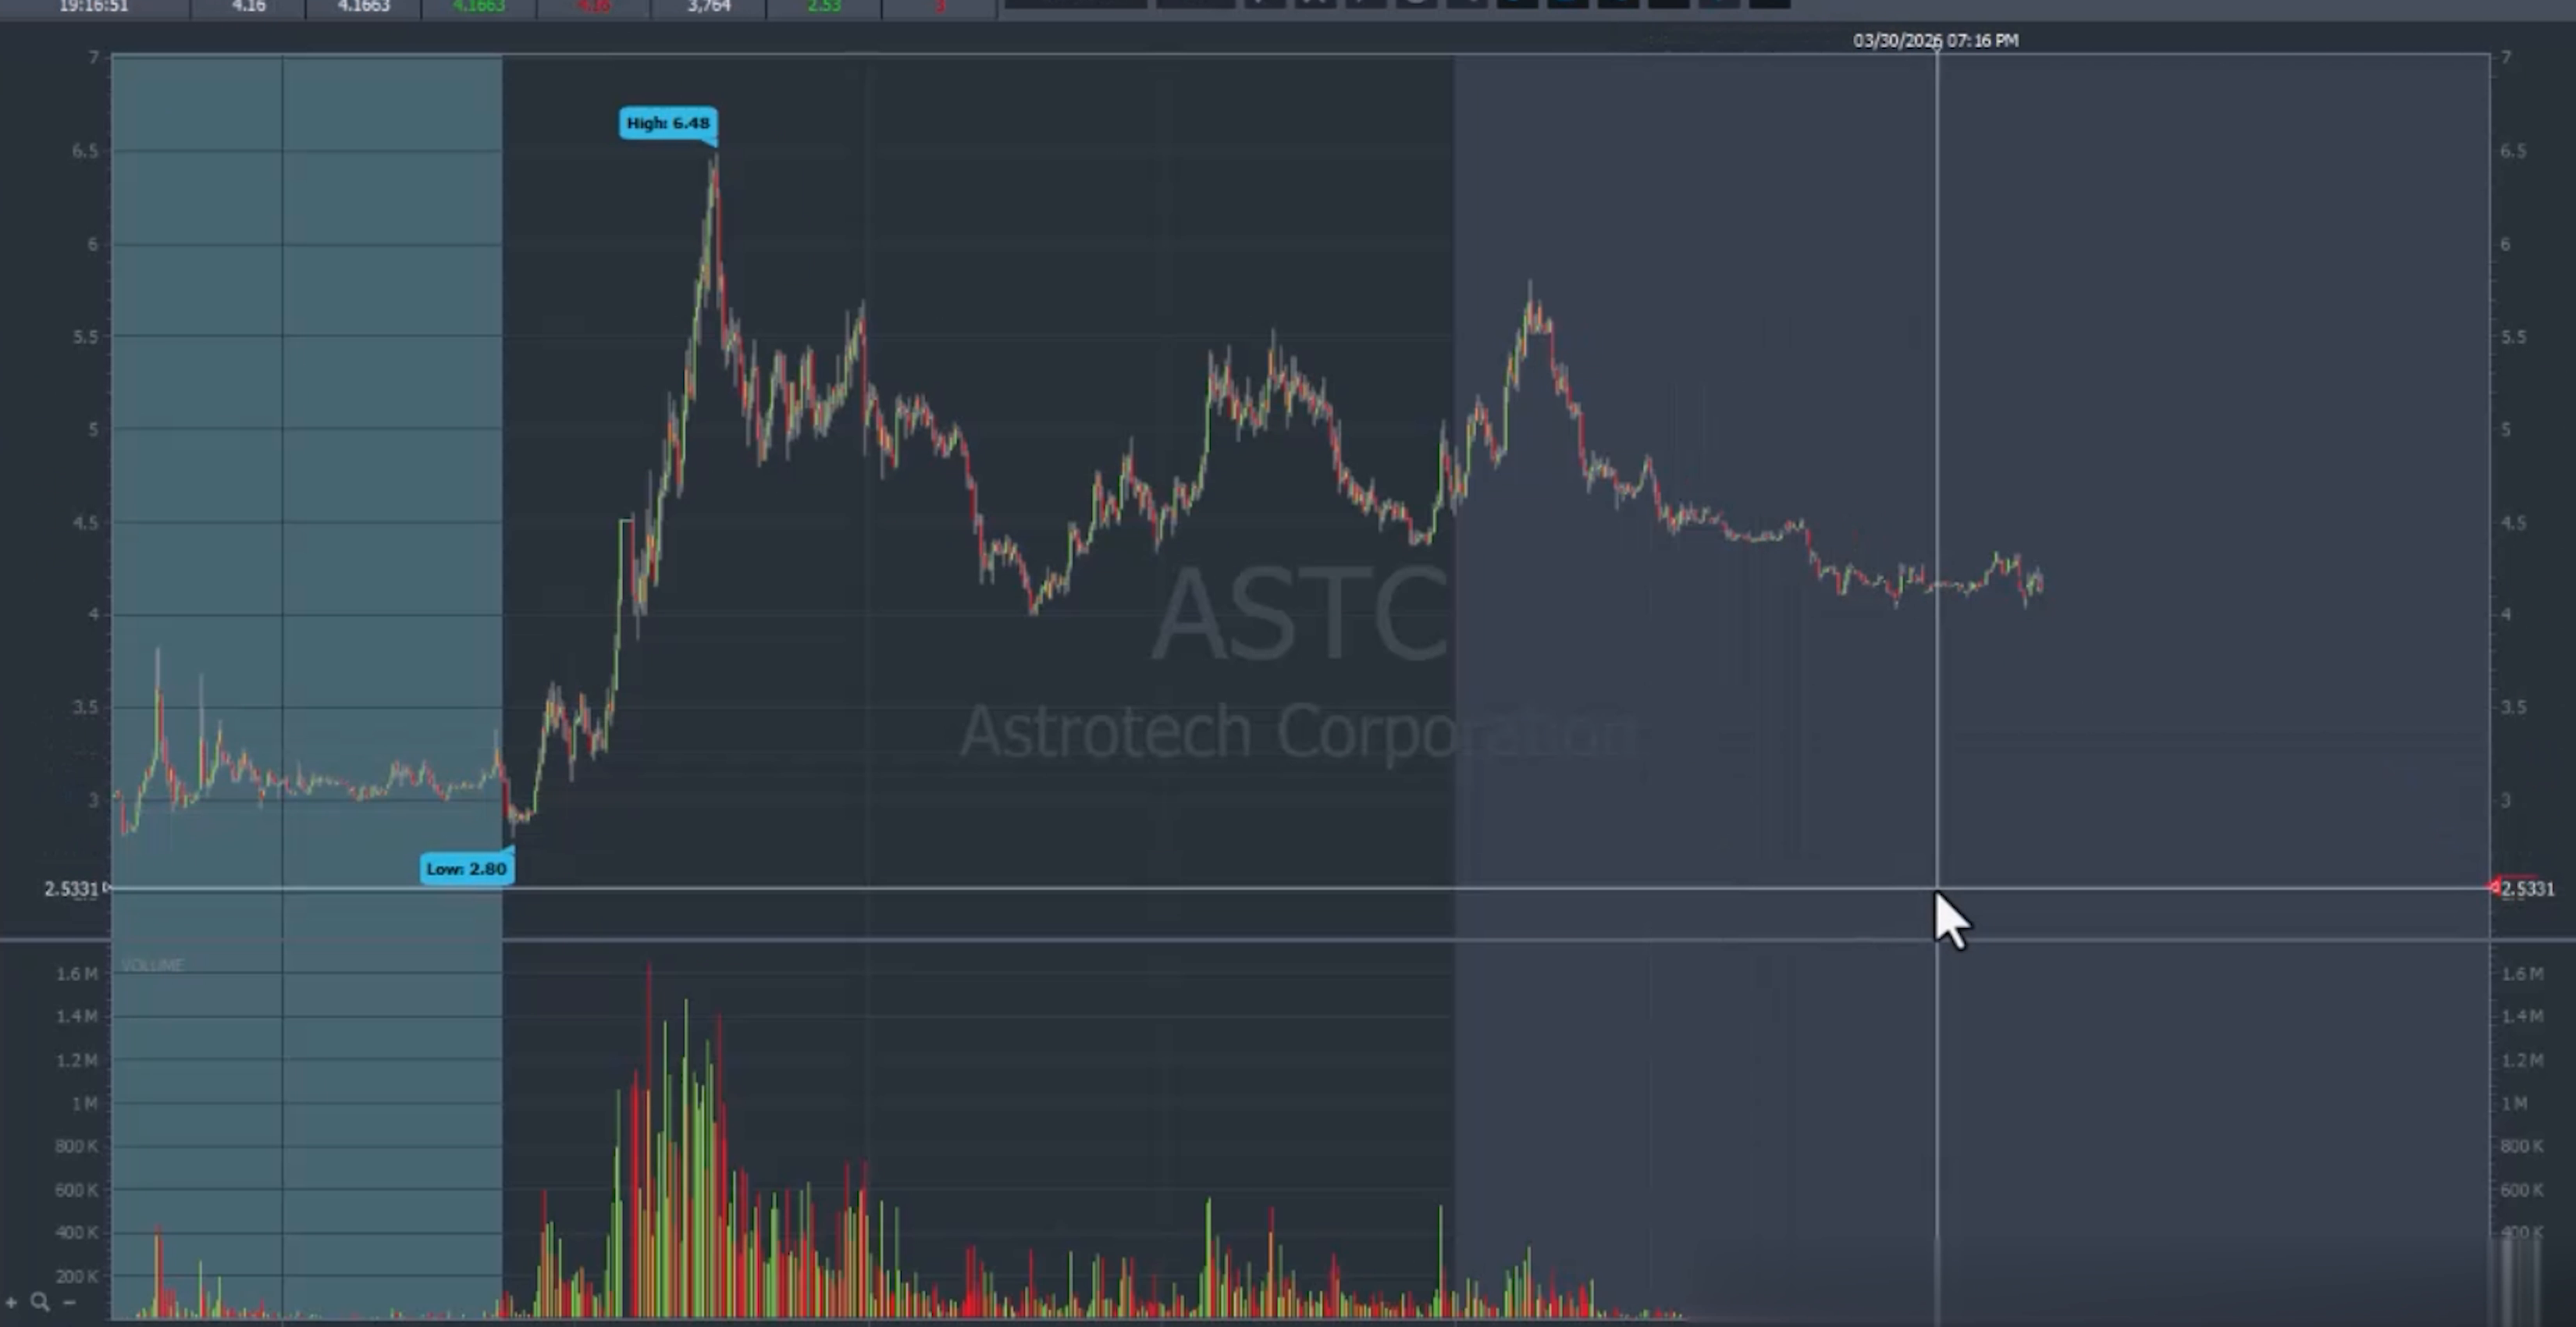
Bounce Short Example: Return Into Trapped Supply
The bounce short example starts with a stock that previously ran from around $2 to $6 while trading heavy volume, then later returned to the previous high area with much less current volume. The prior move left a consolidation zone around the old resistance area, and that zone became the risk area for the later short.
When the stock retested the previous-day high or old consolidation with lower volume, the current buyers could not compete with the trapped supply from the original move. Shorting near that resistance gave defined risk and let the fade work as prior holders sold into the bounce.
The lesson is to compare current demand against old trapped supply. A bounce short is strongest when the original high-volume area is large, current volume is weaker, and price returns close enough to resistance that risk can be defined tightly.
Key Lessons
Dux's small-cap short playbook is built on the idea that patterns are only useful after the data qualifies them. The first filter is whether the stock belongs in the universe, whether the volume is tradable rather than dangerously crowded, whether the sector is acceptable, and whether current buying power is likely to overwhelm or fail against supply.
The practical lesson is patience. The best short is rarely the first moment a stock looks overextended. The better trade appears when the statistics, human psychology, volume ratio, and risk location all point to the same conclusion. When those pieces do not line up, the correct trade is no trade.
Want to Learn More?
If you want to go beyond this one strategy and learn trading the right way, from the basics to advanced, Chart Academy is where to do it.
Chart Academy is the world's first free, all-in-one trading education platform, built to help traders learn real, practical skills from world-class traders. It offers in-depth masterclasses taught by professional traders across stocks, options, futures, forex, crypto, and trading psychology. Alongside the masterclasses, Chart Academy includes personalized learning paths, downloadable resources, and access to exclusive tools and rewards, all in one place. There are no subscriptions, no paywalls, and no credit card required. The goal is to make high-quality trading education accessible, practical, and easy to follow for traders of all levels.
Start learning for free on Chart Academy.


.svg)

.svg)