

Built For
Instruments: Stocks
Trading Style: Swing Trading/ Position Trading
Strategy Overview
The Super Stock Momentum Trading Strategy focuses on identifying stocks capable of making unusually large moves and entering them at favorable points during their uptrends.
Instead of buying stocks simply because they appear cheap, the strategy looks for companies and market themes attracting strong demand. These stocks often spend months or years consolidating before breaking out and beginning a powerful trend.
The goal is to identify these opportunities early enough to capture a meaningful portion of the move without taking unnecessary risk.
The strategy combines six stock-selection criteria with five entry setups. The selection process identifies which stocks are worth trading, while the setups determine when to enter.
The process follows this sequence:
Identify a Super Stock → Evaluate Market Conditions → Wait for a Valid Setup → Define Risk → Enter → Manage the Trend
The goal is to capture the strongest portion of a stock’s move while keeping losses controlled when a setup fails.
Strategy Parts
Part 1: Identifying a Super Stock
The first step is identifying stocks capable of producing unusually large price moves.
Not every stock with a bullish chart qualifies as a Super Stock. Connor uses six characteristics to narrow down the market and focus on stocks with the greatest potential.
These characteristics combine technical structure, liquidity, volatility, market themes, and fundamental catalysts.
1. Large Daily or Weekly Base
The first characteristic is a large consolidation base on the daily or weekly chart.
Many stocks that eventually produce substantial moves spend a long period trading sideways before beginning their uptrend.
This consolidation can last several weeks, months, or even years.
During this period, the stock goes through a process of supply and demand adjustment. Weak holders may sell their positions, selling pressure can gradually decrease, and institutions may begin accumulating shares.
The longer the consolidation, the more significant the eventual breakout can become.
What to look for:
- A well-defined consolidation lasting weeks, months, or years.
- Clear resistance near the upper boundary of the base.
- Signs of tightening price action as the stock approaches resistance.
- Increasing volume when price begins breaking out.
The objective is not to buy a stock simply because it has been consolidating for a long time.
The strategy waits for the stock to begin moving out of the base, showing that demand may be taking control.
A large base creates the opportunity, but the breakout provides the trading setup.
2. Linear Price Movement
The second criterion is linearity.
A linear stock tends to move in a relatively consistent direction once its trend begins. Instead of repeatedly reversing, it follows a recognizable uptrend and often respects important moving averages.
These stocks are easier to manage because their price behavior is more predictable from a trend-following perspective. To evaluate linearity, look at the stock’s previous price history.
For example, when the stock broke out of earlier consolidations, did it continue trending for several weeks or months?
Or did it quickly reverse and return to its previous trading range?
Stocks that repeatedly break out and immediately reverse are less attractive for this approach.
The preferred characteristics are:
- Strong directional moves after breakouts.
- Orderly pullbacks during the trend.
- Consistent respect for moving averages.
- Less choppy, mean-reverting price behavior.
Linearity becomes particularly important when managing a position.
A stock that respects the 10-day or 21-day moving average may allow the trader to remain in the position through a substantial move without reacting to every small pullback.
3. Strong Liquidity
Liquidity is another important requirement.
The strategy focuses on stocks trading substantial daily dollar volume because these stocks are more likely to attract institutional participation. Large institutions need sufficient liquidity to build and reduce positions.
Their participation can help support a stock’s trend and create sustained buying demand.
The liquidity requirement discussed in the episode is:
Minimum daily dollar volume: approximately $80 million.
The preferred range is around $80 million to $100 million or more per day. This is not a fixed requirement for every account size. Larger portfolios may need significantly more liquidity.
Thinly traded stocks are generally avoided because their movements can be more erratic and difficult to trade consistently.
Liquidity also becomes important when scaling positions as the amount of capital being managed increases.
4. High Average True Range (ATR)
The fourth criterion is volatility.
Average True Range measures how much a stock typically moves over a given period.
The strategy focuses on stocks capable of making substantial daily price movements because these are the stocks that can produce meaningful swing-trading returns.
The preferred screening requirement is:
ATR of at least approximately 5% of the stock’s price.
A stock moving only 1% per day may not offer the same return potential as one regularly moving 5% or more.
High-ATR stocks can produce significant gains over a relatively short period, but they also require careful position sizing.
A stock capable of moving 5–10% in a day can move sharply against a position. The objective is therefore to combine high volatility with a clearly defined entry and stop. High ATR alone does not make a stock attractive. It must also meet the other selection criteria.
5. Hot Theme, Narrative, or Industry Group
The fifth criterion is identifying where market attention and capital are concentrated.
Strong market moves often develop across entire industries rather than in isolated stocks.
When several companies in the same industry begin showing similar chart patterns, it can indicate that institutional money is flowing into that group.
For example, during a strong memory-stock cycle, companies such as SanDisk, Micron, Western Digital, and Seagate may begin moving together.
This creates additional confirmation that the move is supported by broader industry demand.
The strategy evaluates three connected factors.
Industry Group
Look for several stocks within the same industry showing strength, similar consolidations, or breakouts.
Market Theme
Identify the major trends attracting attention and investment.
Examples discussed include artificial intelligence, memory, space exploration, energy infrastructure, quantum computing, and rare earth materials.
Narrative
Understand why investors are interested in the stock or industry and what future developments they may be anticipating.
Identifying Leaders and Laggards
Not every stock within a strong industry group will perform equally.
The strategy distinguishes between leaders and laggards.
A leader typically breaks out earlier, shows stronger relative strength, and develops a cleaner trend.
Laggards may begin moving later as investors look for additional opportunities within the same theme.
Sometimes the second- or third-strongest stock begins outperforming after the original leader becomes extended. However, when the weakest companies in a group suddenly begin making large moves while the leaders are topping, it can signal that the broader theme is becoming exhausted. The objective is to identify the strongest opportunities within the group while monitoring the behavior of related stocks.
6. Meaningful Catalyst
The final criterion is a catalyst capable of changing how the market values a stock.
A catalyst gives investors a reason to reconsider the company’s future prospects.
Examples include:
- Strong earnings results or improved guidance.
- Major partnerships or business agreements.
- New contracts or significant business developments.
- Industry developments that create new demand.
However, the catalyst alone is not enough.
The market’s reaction is just as important as the announcement itself.
A company may report excellent earnings, but if the stock fails to respond positively, the news may already be reflected in its price.
The strongest opportunities occur when a meaningful catalyst is followed by a powerful price reaction and unusually high trading volume.
This combination can indicate that institutions are reassessing the company’s value and increasing their exposure.
Part 2: Understanding the Stock’s Life Cycle
Once a stock meets the selection criteria, the next step is understanding where it is within its larger trend.
Strong stocks rarely move straight upward without interruption.
Instead, they often follow a progression of breakouts, consolidations, pullbacks, and continuation moves.
A typical sequence is:
Large Base → Initial Breakout → Continuation Flag → Moving Average Pullback → Additional Consolidation → Potential Late-Stage Extension
The entry setups can appear at different points throughout this progression.
An episodic pivot may occur near the beginning of the move, while an undercut-and-rally setup may appear later after a market correction.
Understanding this progression helps determine whether a stock is beginning a new trend, continuing an established one, or becoming increasingly extended.
It also prevents the assumption that a stock has been missed simply because it has already made a large move.
A stock that has doubled can still offer another favorable entry if it forms a new setup with clearly defined risk.
The focus remains on the current chart structure rather than how much the stock has already gained.
Part 3: The Five Entry Setups
Once a stock meets the Super Stock criteria, the next step is identifying a favorable entry. The strategy uses five primary setups. These setups provide different opportunities to enter a stock throughout its larger advance.
Connor emphasizes the principle of stock over setup.
Rather than searching for perfect chart patterns in random stocks, the objective is to identify exceptional stocks and use the appropriate setup to enter them.
Setup 1: Base Breakout
A base breakout occurs when a stock moves above an important resistance level after an extended consolidation. The base may have developed over several weeks, months, or years.
How the Setup Develops
The stock spends an extended period trading within a recognizable range. As the consolidation progresses, price may begin tightening near the upper boundary. This tightening is important because it can provide a nearby level for managing risk. When price breaks above the resistance level, the stock may begin a new momentum phase.
A typical sequence is:
Large Base → Tightness Near Resistance → Breakout → Momentum Expansion
Entry
The entry is considered when price breaks above the base’s resistance level.
Connor prefers stocks that have not already advanced significantly before reaching the breakout point.
If a stock has moved 20–30% into resistance, buying the breakout may involve unnecessary risk.
A tighter consolidation near resistance generally provides a more favorable entry.
Stop-Loss
Possible stop references include:
- The previous day’s low.
- The previous week’s low.
- A nearby support level established during the consolidation.
If price breaks out and quickly returns into the base, it may indicate that the stock is not ready to continue higher.
The objective is to enter near the breakout while keeping the potential loss controlled.
Setup 2: Continuation Flag / High-Tight Flag
A continuation flag forms after a stock experiences a strong advance and then pauses.
Instead of immediately reversing, the stock consolidates while maintaining much of its previous gain. This creates an opportunity to enter a stock that has already started moving higher.
How the Setup Develops
The stock first breaks out of a larger base and begins advancing. After the initial move, price enters a shorter consolidation.
During this period, selling pressure may decrease and trading volume can begin drying up.
A high-tight flag is a particularly strong variation of this setup.
The characteristics discussed include:
- An advance of approximately 100% within several weeks.
- A subsequent consolidation with a pullback no greater than approximately 20%.
- Tight price action before the next breakout.
The setup demonstrates that the stock is maintaining significant strength despite its previous advance.
Entry
The entry is considered when price breaks above the continuation flag’s resistance level.
Connor looks for tight price action and decreasing volume during the consolidation.
A shakeout within the flag can also occur before the breakout.
Increasing volume as price breaks higher provides additional confirmation that demand is returning.
Stop-Loss
Risk is defined using the nearby price structure established during the consolidation.
The objective is to enter near the breakout with a clear level indicating that the continuation setup is failing.
Why the Setup Matters
A stock that has already advanced significantly may appear extended. However, a strong continuation flag can indicate that the larger move is still developing.
The first consolidation after a major base breakout is particularly important because the stock may still be early in its momentum phase.
Setup 3: Ascending Moving Average Pullback
A moving average pullback occurs when a stock in an established uptrend returns toward a rising moving average. Instead of breaking down, price finds support and begins recovering.
This setup allows traders to enter a strong stock after its initial breakout.
Moving Averages Used
Connor monitors several moving averages to evaluate the health of a stock’s trend.
Daily chart:
- 5-day SMA.
- 10-day SMA.
- 21-day EMA.
- 50-day SMA.
- 200-day SMA.
Weekly chart:
- 10-week moving average.
- 30-week moving average.
- 40-week moving average.
The 10-week moving average corresponds approximately to the 50-day moving average, while the 40-week corresponds to the 200-day moving average.
Different stocks may respect different moving averages throughout their advances.
The objective is to identify which moving average is providing meaningful support based on the stock’s previous price behavior.
How the Setup Develops
The stock establishes a strong upward trend. After advancing, it begins pulling back toward a rising moving average.
The pullback should be relatively orderly rather than a sharp, uncontrolled decline. Price may briefly move below the moving average before recovering above it.
The first pullback to a rising 50-day SMA after a strong advance is highlighted as an important potential entry.
Entry
The entry is considered when the stock begins recovering from the moving average.
One approach discussed is waiting for price to undercut the moving average and then reclaim it.
This recovery provides evidence that buyers may be returning.
Stop-Loss
The moving average provides a reference for managing risk.
If price reclaims the average but then breaks back below it, the setup may no longer be valid.
Why the Setup Matters
Strong stocks do not move upward continuously.
Even powerful trends experience periods of consolidation and pullbacks.
A rising moving average can provide a reference for entering an established trend without chasing price after a large advance.
Setup 4: Episodic Pivot
An episodic pivot occurs when a major catalyst causes investors to significantly reassess a company.
The stock may have spent a long period receiving limited attention before a meaningful announcement changes expectations.
Strong earnings results are one common catalyst.
How the Setup Develops
The stock initially experiences an extended period of consolidation or neglect. A major announcement creates a sudden increase in demand.
Price gaps higher, often accompanied by unusually high trading volume.
This reaction may indicate that institutional investors are reassessing the company’s future prospects.
The strongest opportunities often occur on the first major earnings gap that changes the stock’s momentum.
Entry: Five-Minute Opening Range Breakout
One entry method discussed is the five-minute opening range breakout.
The process is:
- Identify a stock experiencing a significant catalyst-driven gap.
- Allow the first five-minute candle to form.
- Mark the high of that opening range.
- Consider entry when price breaks above the five-minute high.
Strong episodic pivots may attract substantial buying volume immediately after the market opens.
Connor notes that the strongest examples often begin advancing quickly and do not return to the day’s low.
Stop-Loss
The low of the day can serve as the stop-loss reference.
If price breaks below that level, the opening-range setup may have failed.
Alternative Entry
Connor also mentions waiting for an undercut after the gap as another possible entry approach.
However, he does not provide a complete set of execution rules for that variation in this episode.
Why the Setup Matters
A major earnings surprise or other meaningful catalyst can create the beginning of a new momentum phase.
The strategy looks for situations where the market is reacting to genuinely new information rather than simply continuing an already well-established move.
Setup 5: Undercut and Rally
An undercut and rally occurs when a stock temporarily breaks below an important support level before recovering above it. Connor particularly favors this setup in stocks that have already established strong upward trends.
It can become especially useful when the broader market is experiencing a pullback.
How the Setup Develops
The stock has already demonstrated strong momentum. During a market correction or consolidation, price pulls back toward an important previous level.
This may be a prior breakout level, a recognizable support area, or another important level visible on the left side of the chart.
Price temporarily breaks below that level.
The stock then begins recovering and reclaims the previous support.
This recovery can indicate that the breakdown is failing and buyers are returning.
A typical sequence is:
Established Uptrend → Pullback → Undercut Support → Reclaim → Potential Continuation
Entry
The entry is considered when price reclaims the important level that was previously broken. Connor emphasizes identifying a clear level on the left side of the chart.
The reclaim provides a defined trigger rather than requiring the trader to predict the exact bottom.
Stop-Loss
The stop is placed below the pivot or low established during the undercut.
If price breaks below that level again, the recovery setup may have failed.
Relative Strength
Relative strength is particularly important for this setup. The strategy looks for stocks that hold up better than the broader market during corrections.
For example, the indexes may break below previous lows while a leading stock experiences a smaller pullback.
If the stock begins recovering before the broader market, it may indicate that demand remains strong.
Alternative: High-Volume Close Reclaim
A variation involves reclaiming the closing price of an important high-volume trading day. That closing price becomes a reference level because significant trading activity previously occurred there.
A recovery above the level can provide another potential entry.
The objective is the same: identify a meaningful level, wait for price to reclaim it, and define risk around the setup.
Why the Setup Matters
Breakouts can become less reliable during weak market conditions.
An undercut-and-rally setup provides another way to enter a strong stock without waiting for it to break above its previous highs.
It can offer a favorable entry within an established trend while the broader market is still recovering.
Part 4: Market Conditions and Relative Strength
Market conditions play an important role in determining whether momentum setups are likely to work.
The strategy performs best when the broader market is in an uptrend. During weak markets, even strong stocks can struggle to sustain breakouts.
A simple way to evaluate market conditions is by monitoring QQQ (NASDAQ-100 ETF).
The preferred conditions are:
- QQQ trading above a rising 21 EMA or 50 SMA.
- Leading stocks showing relative strength against the broader market.
- Strong industry groups continuing to attract buying interest.
When the market weakens, the strategy becomes more selective. Undercut-and-rally setups can offer opportunities in stocks holding up better than the indexes.
If conditions are unfavorable, position sizes may be reduced or new trades avoided.
Part 5: Risk Management and Position Sizing
The strategy focuses on keeping losses small while allowing successful trades to generate much larger returns.
Connor describes a win rate of approximately 30–50%, depending on market conditions. The goal is not to win every trade but to make sure large winners can outweigh multiple small losses.
Before entering a trade, the entry, stop-loss, and amount of capital at risk should be defined.
Key risk management principles:
- Place stops based on the setup’s price structure.
- Adjust position size according to the distance between entry and stop.
- Reduce position size when market conditions are uncertain.
- Exit when the setup fails rather than holding through a larger loss.
- Consider re-entering if the stock develops another valid setup.
In one trade discussed, Connor accepted approximately 5–6% stock-price risk while risking less than 1% of assets under management.
The strategy accepts small losses as part of the process, with the expectation that occasional large winners can compensate for them.
Part 6: Taking Profits and Managing Winning Trades
The strategy combines selling into strength with trailing the remaining position until the trend begins to weaken. Rather than trying to predict the exact top, profits are managed according to the stock’s price action.
Taking Partial Profits
The strongest momentum often occurs during the first three to five days after a breakout.
Connor may take partial profits during this period, particularly when the stock is already extended.
For stocks breaking out of major bases or reacting to strong earnings catalysts, he may allow more room for the trend to develop.
Trailing the Position
The 10-day SMA provides a simple way to manage winning trades.
One approach discussed is selling half the position on the first daily close below the 10 SMA. Connor also suggests using that first close as a simple trailing exit rule for beginners.
Another signal is extreme ATR extension. When a stock reaches approximately 10 ATR above its 50-day moving average, it may be becoming overextended and more vulnerable to a pullback.
Exiting on Weakness
After taking partial profits, the remaining position is managed using the stock’s trend and support levels.
Potential exit signals include:
- Breaking an important support level.
- Losing a moving average the stock previously respected.
- A change in character, such as lower highs, sharp declines, or increasing choppiness.
The objective is to capture the strongest portion of the move while exiting when the trend begins to deteriorate.
Part 7: Finding and Preparing Trade Opportunities
The strategy relies on consistently identifying strong stocks before they develop actionable setups. Rather than searching randomly for trades during the trading session, Connor uses a structured process to identify market themes, monitor leading stocks, and prepare potential entries.
Weekend Market Review
The weekend is an important part of the preparation process.
With the market closed, there is more time to review charts, identify developing themes, and evaluate stocks without reacting to intraday price movements.
Connor uses MarketSurge to run scans based on factors such as:
- Price performance.
- Earnings and sales growth.
- Strong industry groups.
- Unusual trading volume.
The results are reviewed and organized by industry group.
The objective is to identify groups where several stocks are demonstrating similar bullish price structures.
Thematic Watchlist
Stocks showing strength within the same industry are grouped into a thematic watchlist.
This helps identify where market interest and buying activity may be developing.
If several stocks within one industry are breaking out or showing relative strength, that group becomes an area to monitor more closely.
The strategy also tracks related stocks that may not currently meet every trading requirement.
Monitoring these names helps evaluate whether the broader group is strengthening or weakening.
Universe Watchlist
The universe watchlist contains stocks that demonstrate attractive characteristics but may not yet offer an entry.
These stocks remain under observation as their technical structures develop.
A stock may enter the universe watchlist after:
- A major catalyst.
- Unusually high trading volume.
- A significant change in price behavior.
- The beginning of a new momentum trend.
The objective is to identify promising stocks early and continue monitoring them until a favorable setup appears.
Actionable Focus List
The actionable focus list is a smaller group of stocks approaching potential entry points. Connor prepares this list before the next trading session.
Each potential trade should have a defined setup and planned entry level. The strategy emphasizes preparing trades in advance rather than making impulsive decisions during market hours.
Earnings-driven episodic pivots are an exception because new catalysts can appear overnight or before the market opens.
These opportunities are evaluated through morning scans.
Selecting Between Multiple Opportunities
During strong markets, several attractive stocks may develop setups simultaneously. Connor prioritizes stocks that meet his criteria and become actionable first.
For example, if several strong stocks are approaching entry levels, capital may be allocated to the first valid setup that triggers.
The objective is not to participate in every opportunity. It is to remain selective and concentrate on stocks that offer favorable setups when capital is available.
Part 8: Trading Discipline and Execution
The strategy requires discipline because strong momentum stocks can appear extended even when they are developing valid entry opportunities.
Connor emphasizes that traders should evaluate the stock’s technical structure rather than allow personal opinions about its price to determine whether they enter.
Prioritize Stock Selection
The quality of the stock is more important than finding a perfect chart pattern.
A strong stock may provide several different setups throughout its advance.
The objective is to focus on the best stocks and use the entry playbook to participate when opportunities develop.
Trust the Setup and Defined Risk
A stock may appear expensive after a significant advance.
However, if it meets the Super Stock criteria and develops a valid entry, the decision should be based on the setup and its defined risk.
The strategy does not require predicting how high the stock will eventually move.
Instead, it requires knowing where the trade is invalidated and how much capital is at risk.
Avoid Impulsive Entries
Connor prefers planned trades.
Entering simply because a stock is moving rapidly can lead to poor execution and unnecessary risk.
The objective is to identify the entry trigger before the trade and act when the planned conditions are met.
Accept Small Losses
Not every valid setup will succeed.
A stock may break out, return to its base, and require more time before developing another opportunity.
The strategy accepts these unsuccessful trades as part of the process.
A failed entry does not necessarily mean the stock is no longer attractive.
If another valid setup develops, the stock may be considered again.
Remain Selective
Strong markets can produce more opportunities than a trader can reasonably take.
Weak markets may produce very few.
The strategy emphasizes trading the strongest opportunities rather than forcing trades simply to remain active.
The objective is to preserve capital during unfavorable conditions and participate when strong stocks develop actionable setups.
 NinjaTrader
Test this strategy on NinjaTrader before you risk a dollar
14 days free simulated trading trial. Practice your edge without risking your capital.
Trade Breakdown
Trade Example: SanDisk (SNDK)
Connor uses SanDisk as an example of how a strong momentum stock can offer multiple trading opportunities throughout its uptrend.
SanDisk had formed a multi-month base before breaking out. The stock was benefiting from growing demand for memory used in AI, while other companies in the same industry, including Western Digital and Seagate, were also moving higher.
This made SanDisk an attractive Super Stock candidate.
First Entry: High-Tight Flag
After breaking out of its base, SanDisk advanced more than 100% in approximately one month.
Connor watched the initial breakout but did not enter. Instead, he waited for another opportunity.
The stock eventually formed a high-tight flag:
- Price had advanced more than 100%.
- A short consolidation developed after the advance.
- The pullback remained below 20%.
- Price briefly shook out traders before moving higher again.
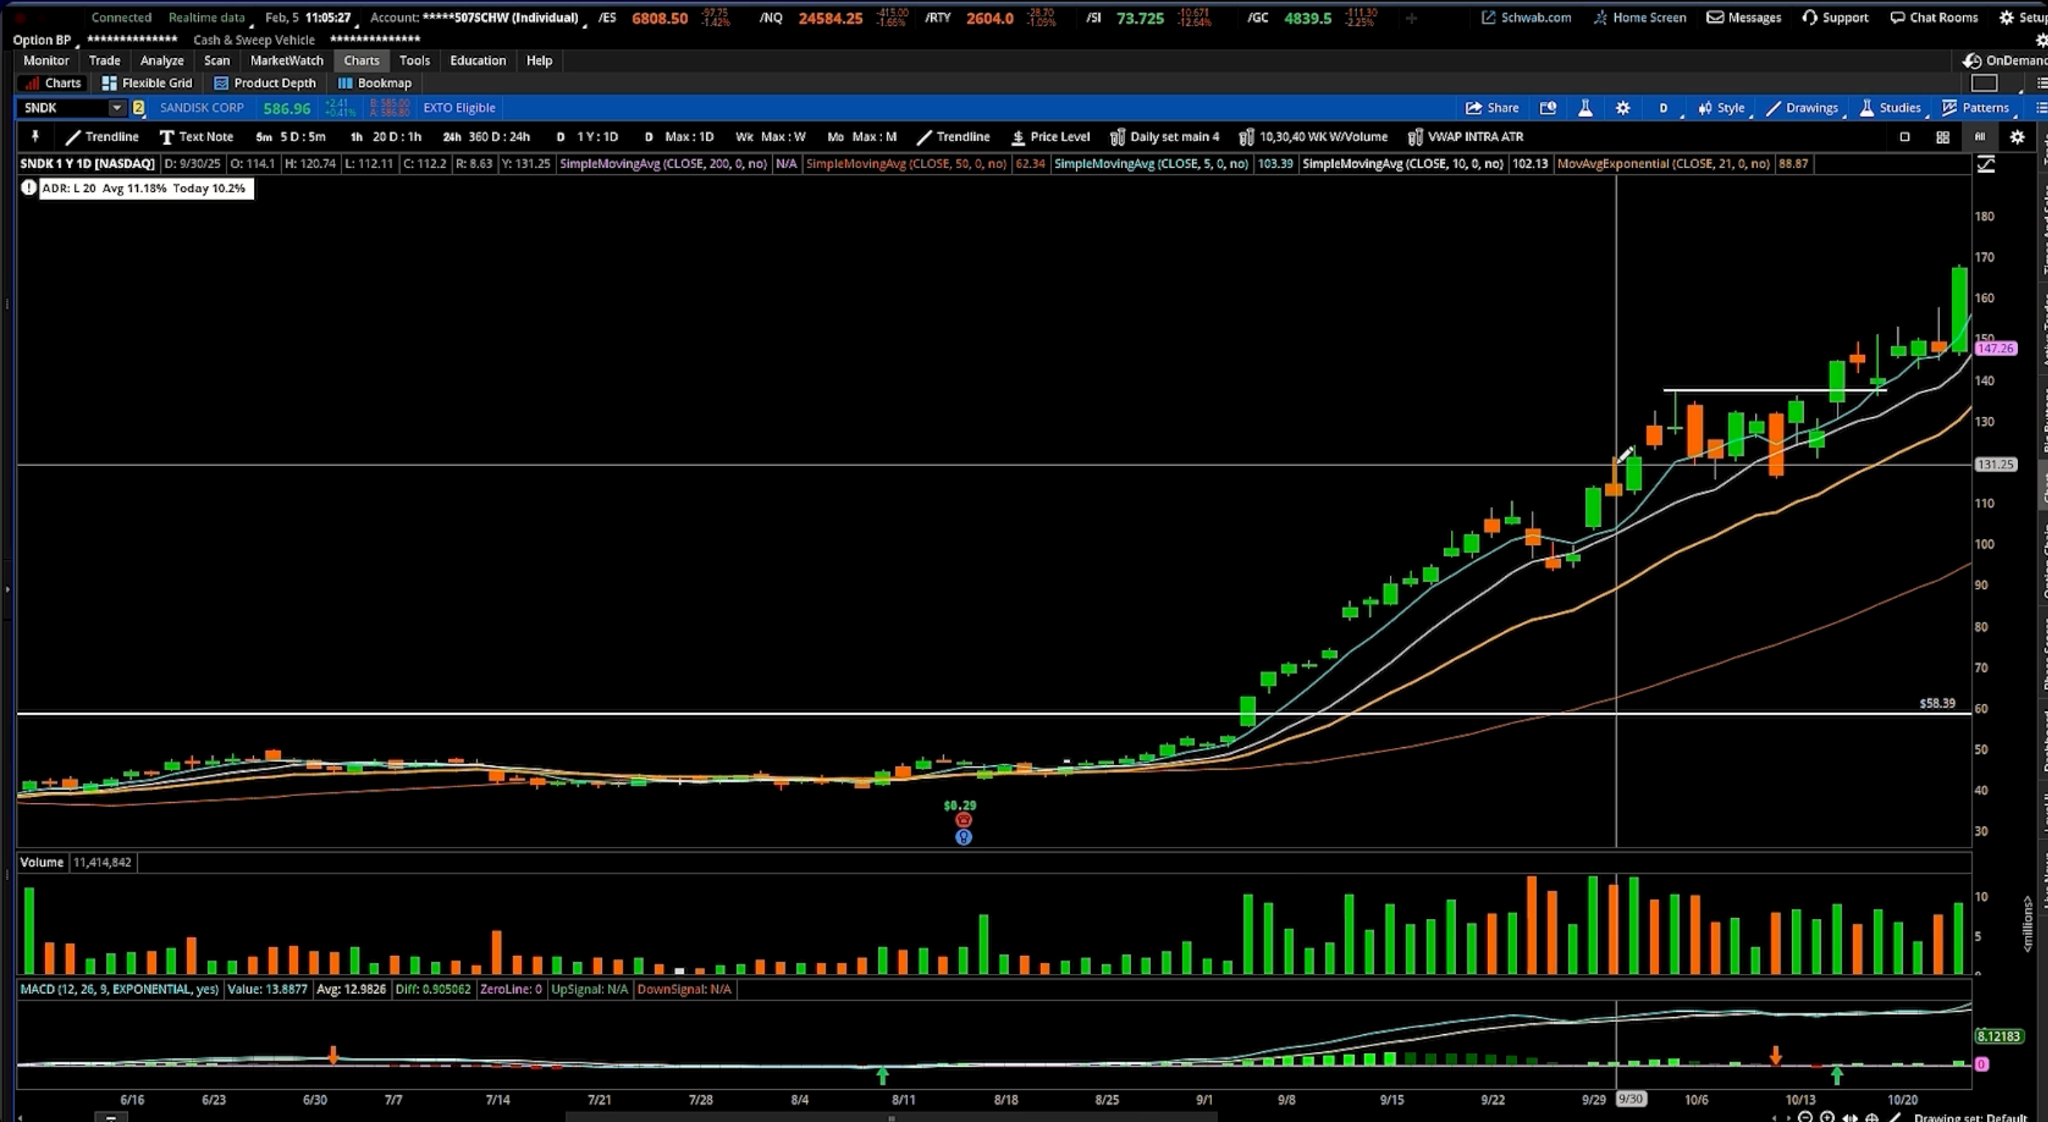
Connor entered SanDisk at approximately $135 as the stock broke out of this consolidation.
The trade worked, and SanDisk advanced approximately another 100% from that area.
Connor gradually sold portions of his position as the stock moved higher. When a sharp decline signaled a change in character near the 21-day EMA, he exited the remaining position.
Second Entry: 50-Day Moving Average Pullback
Even after exiting, Connor continued watching SanDisk because it remained a strong stock within a leading industry.
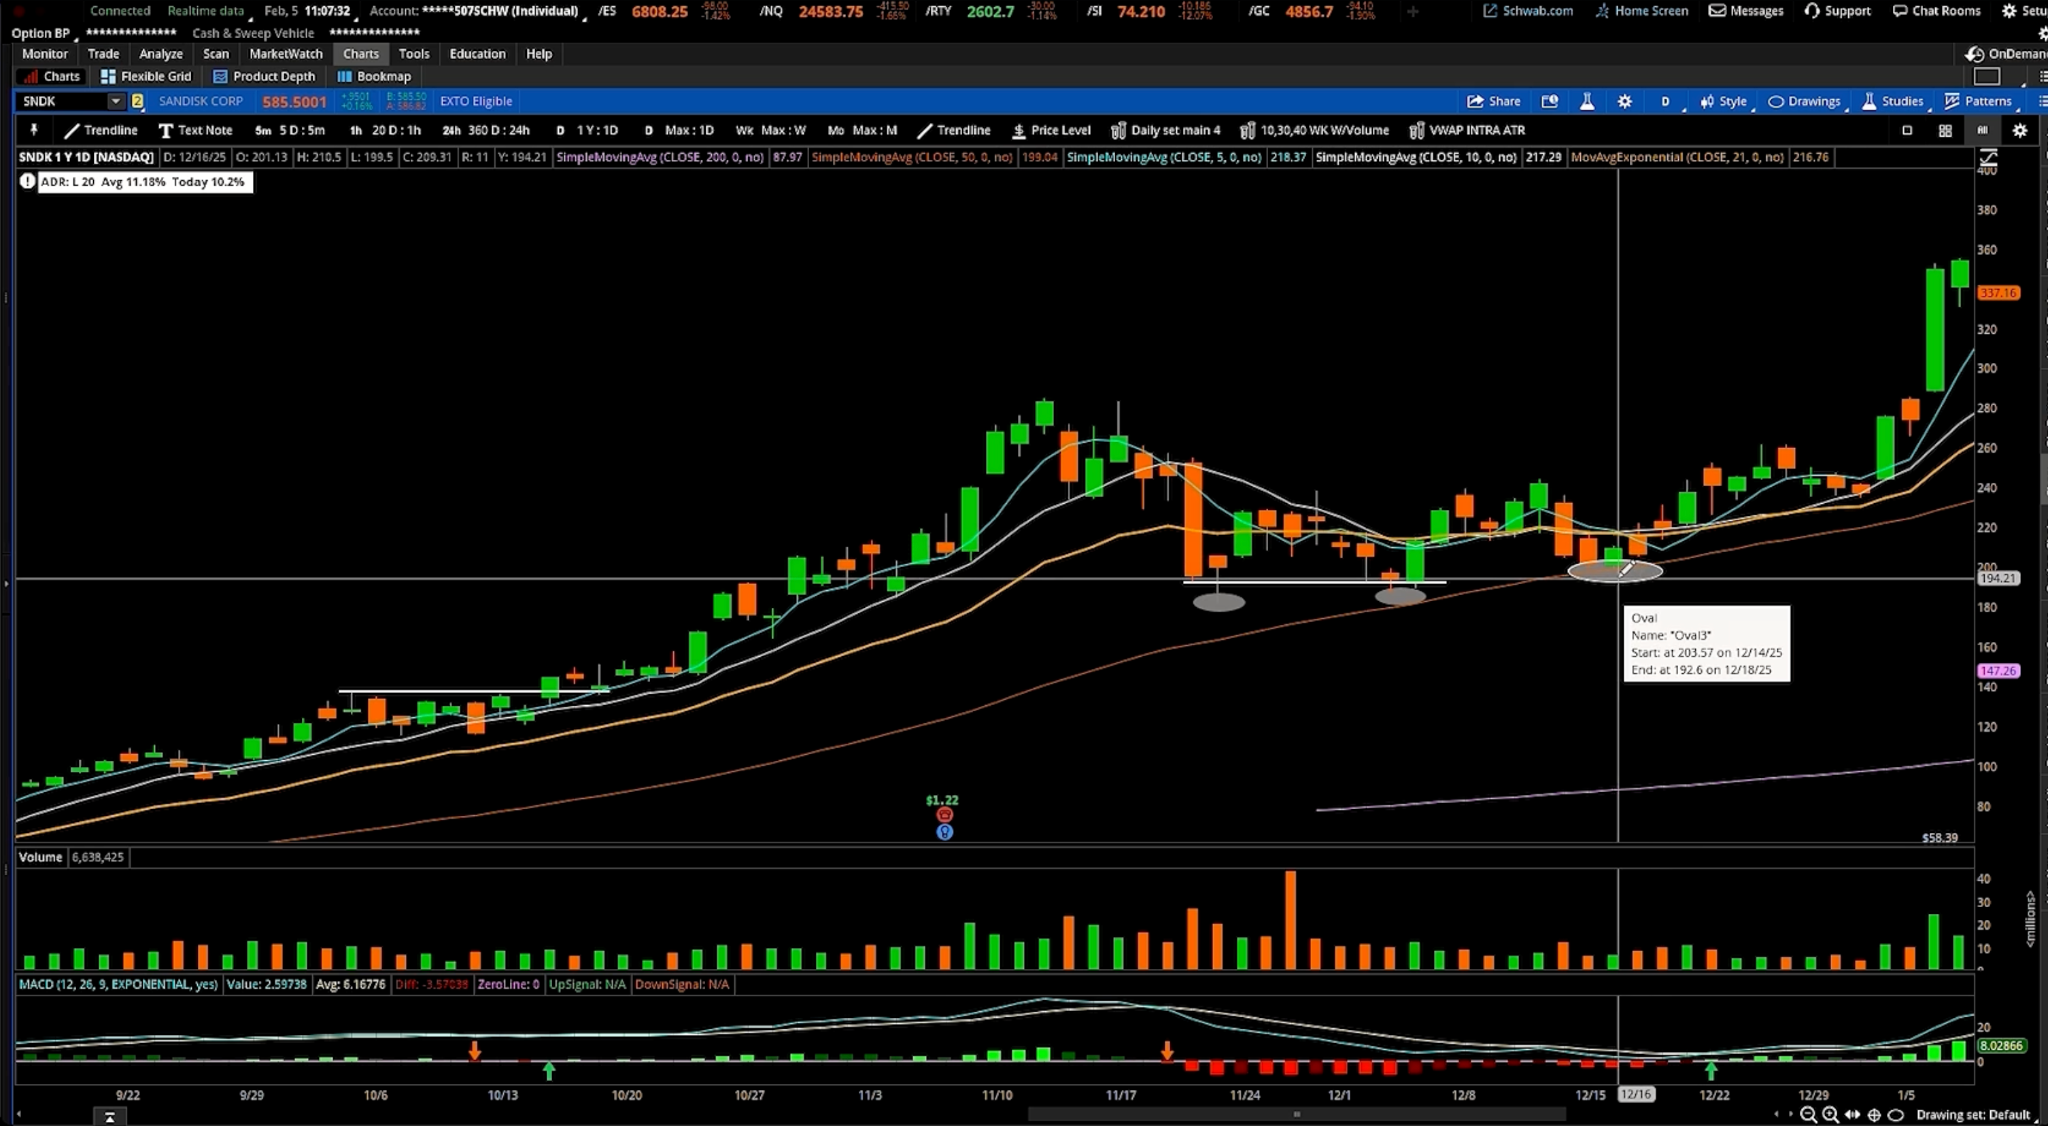
Following its advance, the stock pulled back and began consolidating near its rising 50-day SMA.
The setup was attractive because:
- It was the first major pullback toward the 50-day SMA after a strong advance.
- Price continued holding above the moving average.
- The stock formed higher lows and a tighter consolidation.
Connor re-entered during this consolidation. SanDisk then formed a cup-and-handle-style base and broke above resistance, providing another opportunity to add to the position.
The stock continued advancing, eventually moving above $300 and producing another gain exceeding 100% from the breakout area.
Trade Management
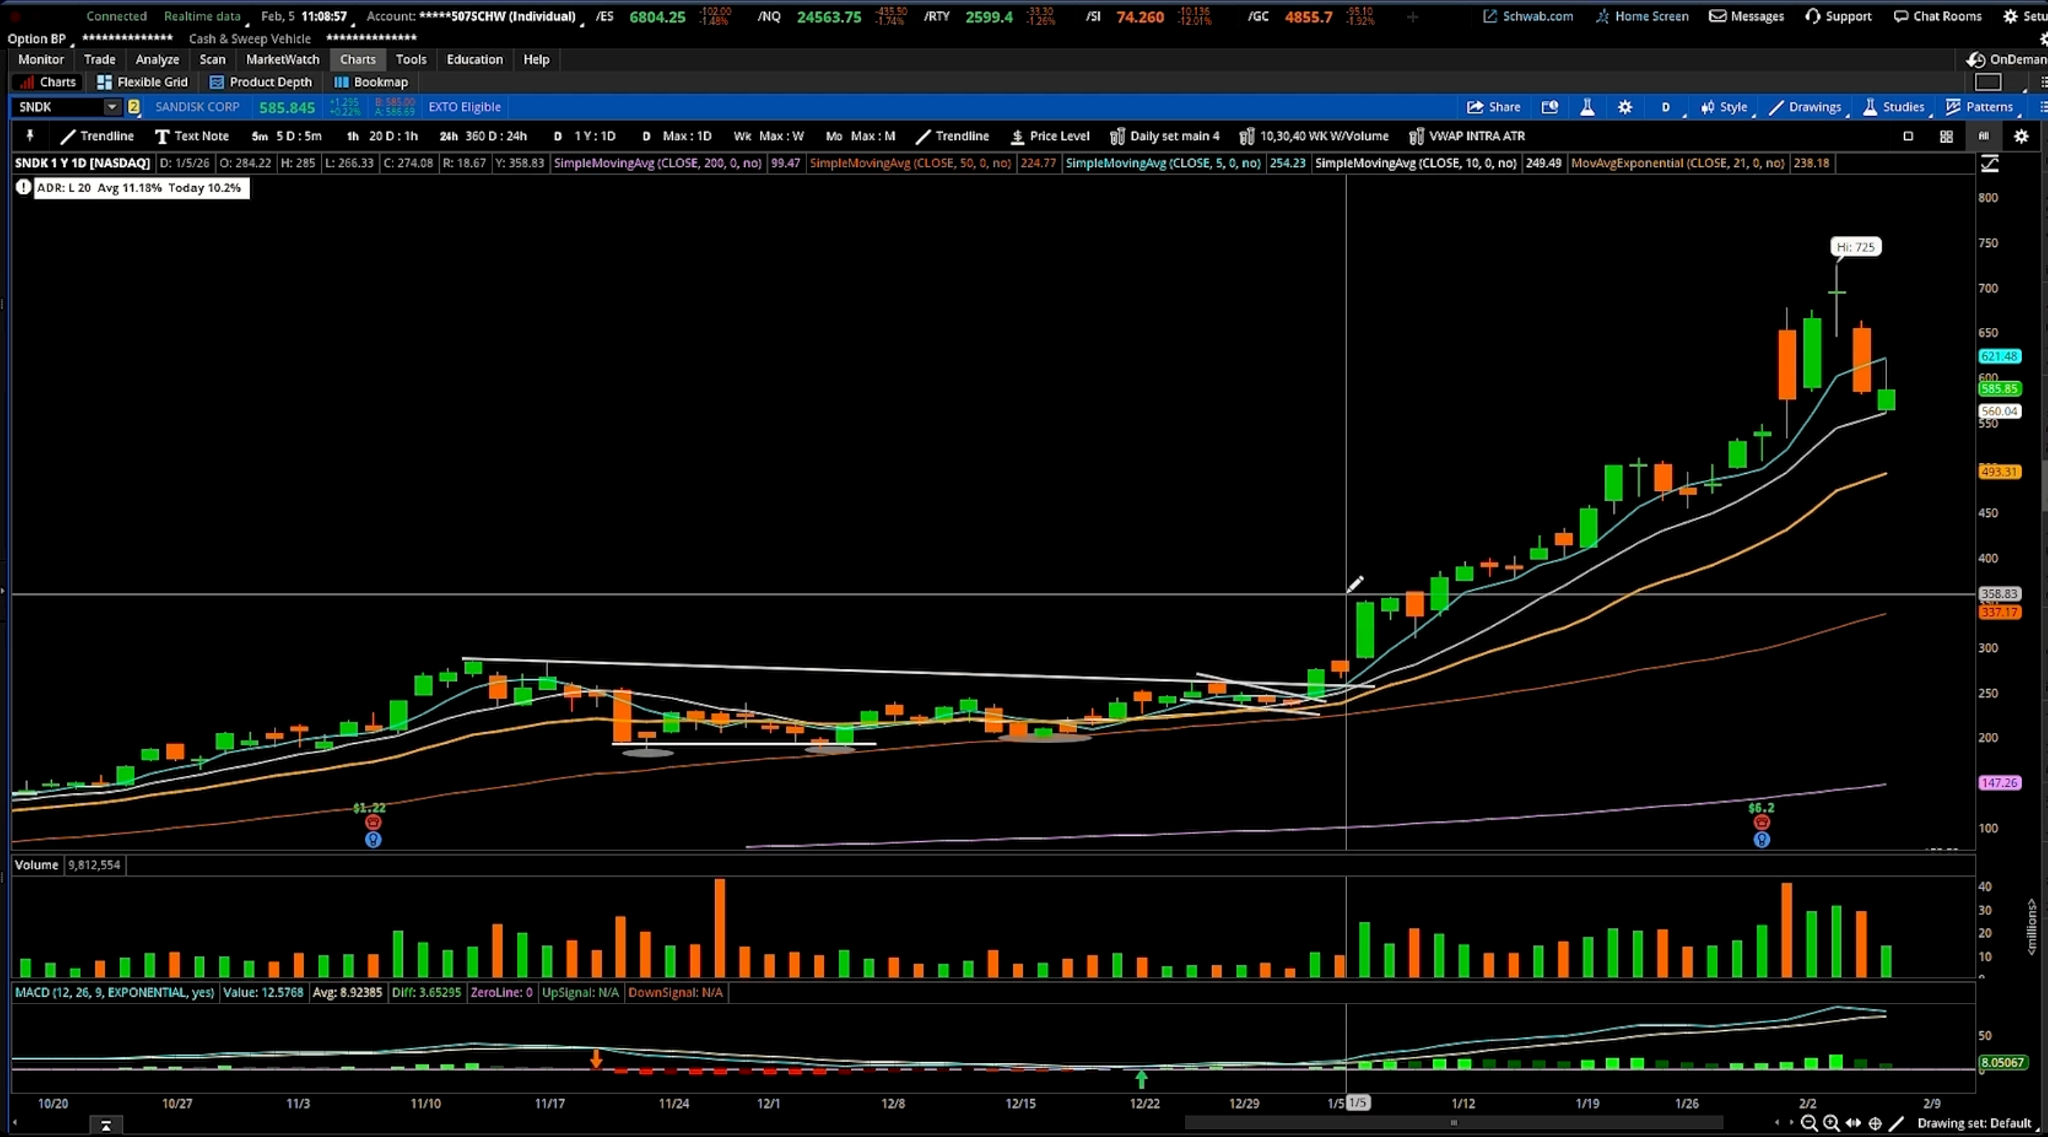
During the second advance, SanDisk repeatedly respected its rising 5-day SMA.
Connor took partial profits as the stock moved higher, including around a major earnings gap.
He eventually reduced the position to a small remaining amount, which he continued to manage using the stock’s price action.
Key Takeaway
SanDisk demonstrates how one strong stock can provide several opportunities throughout its uptrend.
High-Tight Flag → Take Profits → 50-Day SMA Pullback → Re-Entry → Base Breakout → Take Profits
Connor did not buy the initial breakout or hold the stock continuously. Instead, he entered when a valid setup developed, took profits when the trend weakened, and re-entered when another opportunity appeared.
The goal is not to catch the entire move but to use repeatable setups to participate in the strongest parts of a stock’s advance.
Trade Example 2: Planet Labs (PL)
Connor uses Planet Labs as an example of how an earnings catalyst can create an opportunity to enter a strong momentum stock.
Planet Labs had formed a large base before beginning its advance. The company was benefiting from growing interest in the space industry, supported by improving financial results and a growing backlog.
Identifying the Opportunity
Planet Labs first caught attention after reporting positive earnings developments, including its first positive free cash flow and a significant backlog.
The stock experienced a large earnings gap on exceptionally high volume, signaling a potential change in momentum.
Connor did not enter this initial move. Instead, he continued watching the stock as it developed a strong upward trend.
Later, Planet Labs reported another strong earnings release, creating a new opportunity.
The setup was attractive because:
- The stock had already demonstrated strong, consistent upward momentum.
- The space industry was attracting significant market interest.
- Earnings exceeded expectations, with improved guidance.
- Price was breaking above an important previous high.
- The stock was gapping higher on strong volume.
Trade Entry: Five-Minute Opening Range Breakout
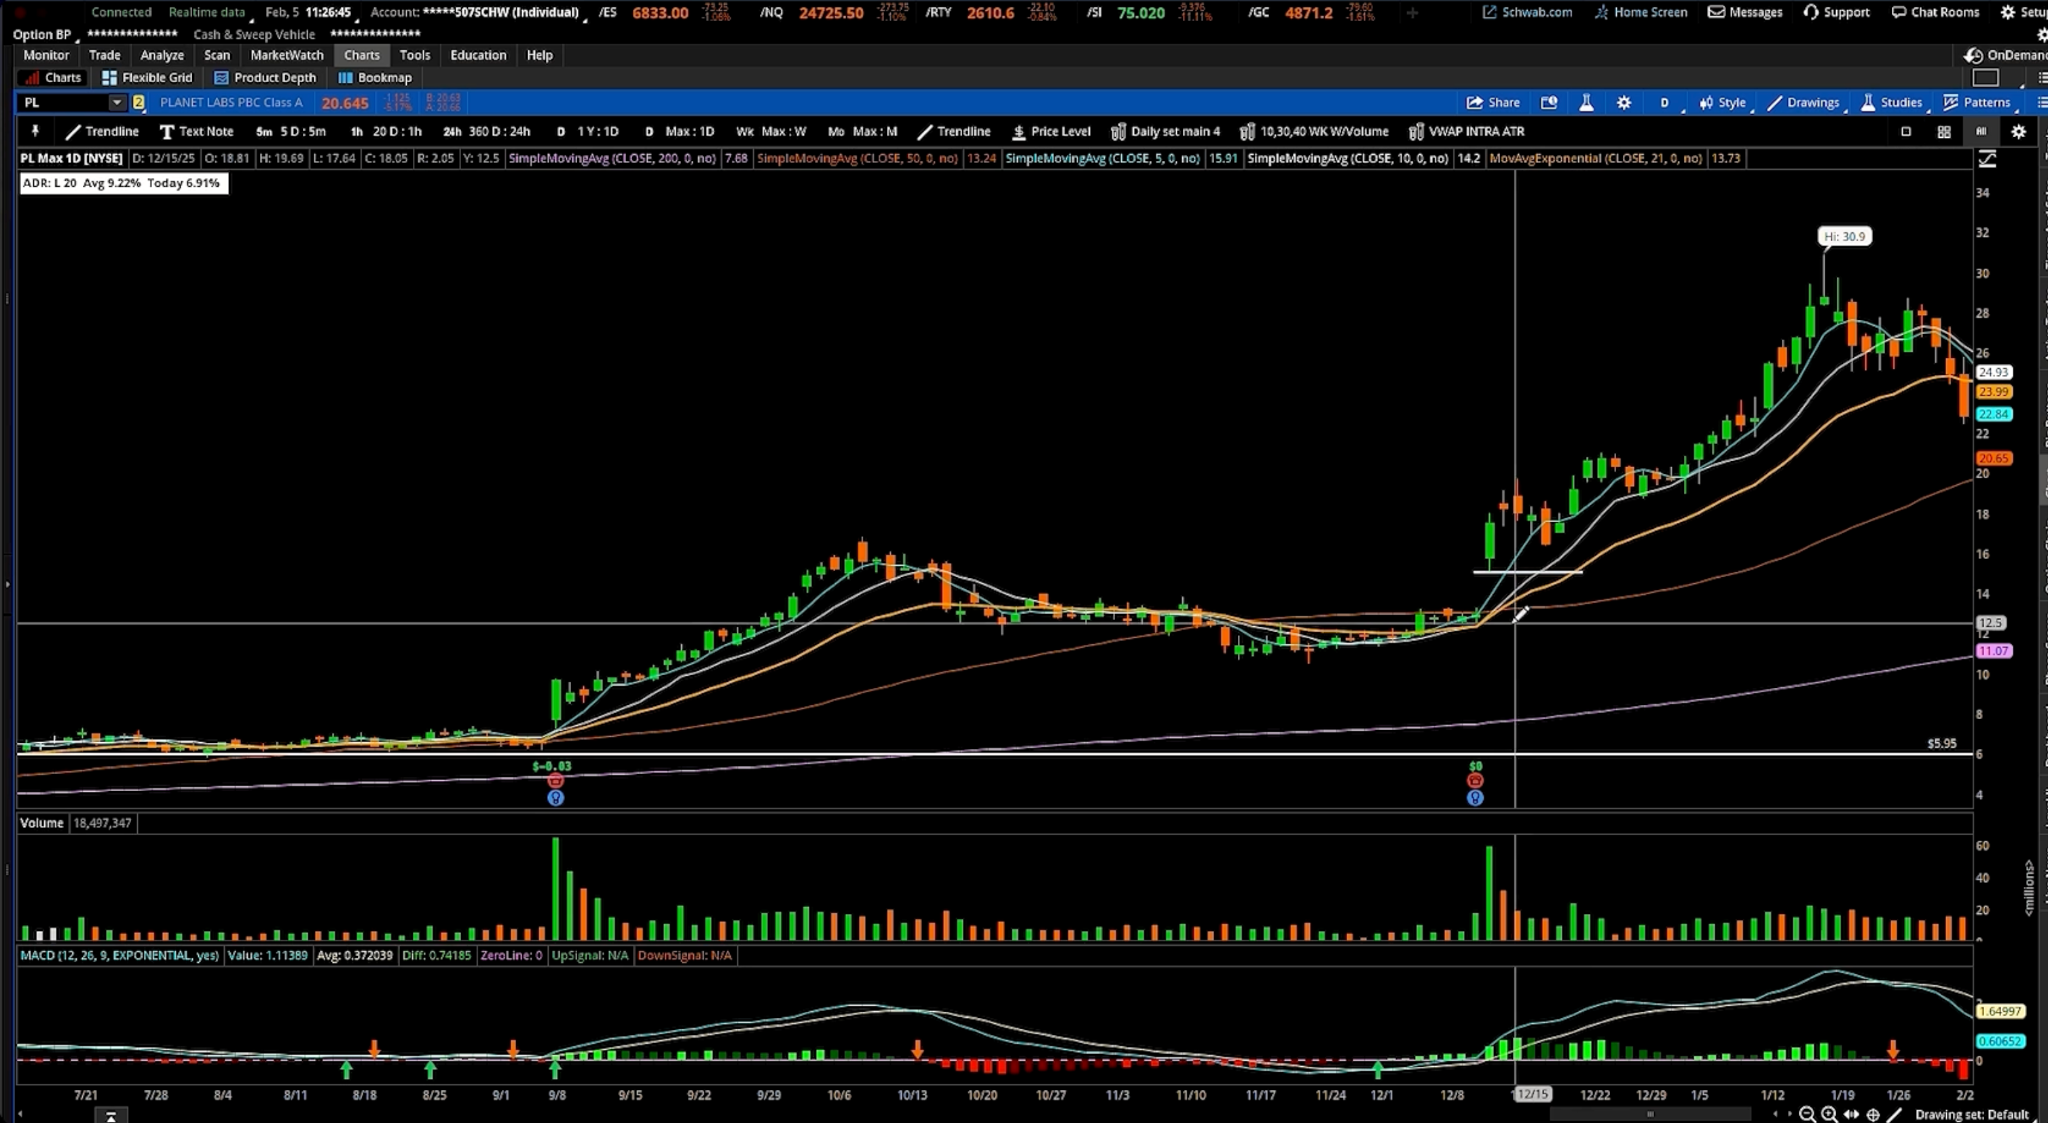
Connor entered Planet Labs following the new earnings gap.
Rather than buying immediately at the market open, he used the five-minute opening range to identify his entry.
Trade Execution:
- Entry: Buy when price breaks above the high of the first five-minute candle.
- Stop-Loss: Below the low of the day.
- Risk: Approximately 5–6% on the stock, representing less than 1% of assets under management.
After entering, the stock briefly pulled back but remained above the stop-loss. Connor followed his original plan and stayed in the trade.
Trade Management and Exit
Planet Labs continued moving higher, eventually gaining approximately 70% from the entry area.
Connor took partial profits as the stock advanced, allowing the remaining position to continue benefiting from the trend.
Eventually, the stock began showing signs of weakness:
- Price started forming lower highs.
- Moving averages began turning downward.
- An important short-term support level broke.
Connor exited the remaining position as the stock’s momentum weakened.
Key Takeaway
The Planet Labs trade demonstrates how a strong earnings catalyst, combined with an established momentum trend, can create a high-potential entry.
Strong Earnings → Gap Up → Five-Minute Opening Range Breakout → Defined Stop-Loss → Take Partial Profits → Exit on Weakness
Connor did not need to predict how far the stock would rise. He entered with a defined risk of approximately 5–6% and managed the position as it advanced approximately 70%.
The main lesson is to identify a strong stock, wait for a valid entry, control the downside, and allow the winning trade to develop.



