Built For
Instruments: Futures
Trading Style: Scalping/Day Trading
Strategy Overview
The Volume Profile & Order Flow Trading Strategy focuses on identifying where market participants have established positions, understanding which side is controlling the market, and finding trading opportunities when price reaches important areas.
The strategy is built around the idea that trading does not need to involve dozens of indicators, complicated chart patterns, or constant analysis across multiple timeframes. Instead, every trading decision should contribute to a clear and repeatable process.
Casper’s approach is built around three main decisions:
- Market Condition: Determine the market’s direction and whether the session is likely to be volatile or choppy.
- Trading Zones: Identify the important price areas where other market participants may become active.
- Entry Triggers: Wait for confirmation that buyers or sellers are taking control before entering.
The complete process follows:
Market Condition → Trading Zones → Entry Triggers → Trade Management
Volume Profile is used to identify market conditions and important trading levels. Market structure and order flow are then used to identify entries. Once a trade is open, the focus shifts to managing risk and allowing profitable positions to continue while the market supports the trade.
An important principle is that the strategy does not use fixed take-profit orders. Instead, stops are adjusted as the market develops. The objective is not to predict exactly where the market will move. It is to identify an advantage, react to the market, and remain in a position while the expected side continues controlling price.
Understanding the Trading Edge
The foundation of the strategy is understanding why a trading opportunity exists. Many traders focus on identifying chart patterns or technical signals without considering what is happening behind those movements.
This strategy takes a different approach. Instead of relying only on a pattern, it attempts to identify where other market participants have established positions and where they may be forced to act.
Execution vs. Forced Participation
A trading edge can come from executing a particular setup effectively or from identifying situations where other traders may be forced to execute.
Casper focuses on the second approach. When significant trading activity occurs at a particular price, participants establish positions in that area.
If the market later moves away and returns, those participants may need to defend their positions, close losing trades, or adjust their exposure. These actions can contribute to price movement.
The strategy uses Volume Profile to identify areas where trading activity occurred and then observes how buyers and sellers respond when price returns.
A level alone does not provide an entry. The market must demonstrate that the expected participants are becoming active.
Making Trading Decisions Mechanical
The strategy is designed to reduce unnecessary analysis. Every concept should help answer one of three questions:
- What condition is the market in?
- Where should trades be considered?
- What confirms an entry?
The goal is to make these decisions clear enough that the trader can recognize whether the conditions support taking a trade. This also makes it easier to avoid trading when the market does not provide a clear advantage. Rather than trying to predict every movement, the strategy focuses on reacting to specific market conditions.
Volume Profile and Auction Market Theory
Volume Profile is the primary tool for understanding where trading activity has occurred. Traditional volume indicators show how much volume was traded during a particular candle or period.
Volume Profile shows how much volume was traded at different prices. This is known as volume at price.
By examining where trading activity is concentrated, the strategy identifies important areas where buyers and sellers previously participated. These areas provide information about where the market may react when price returns.
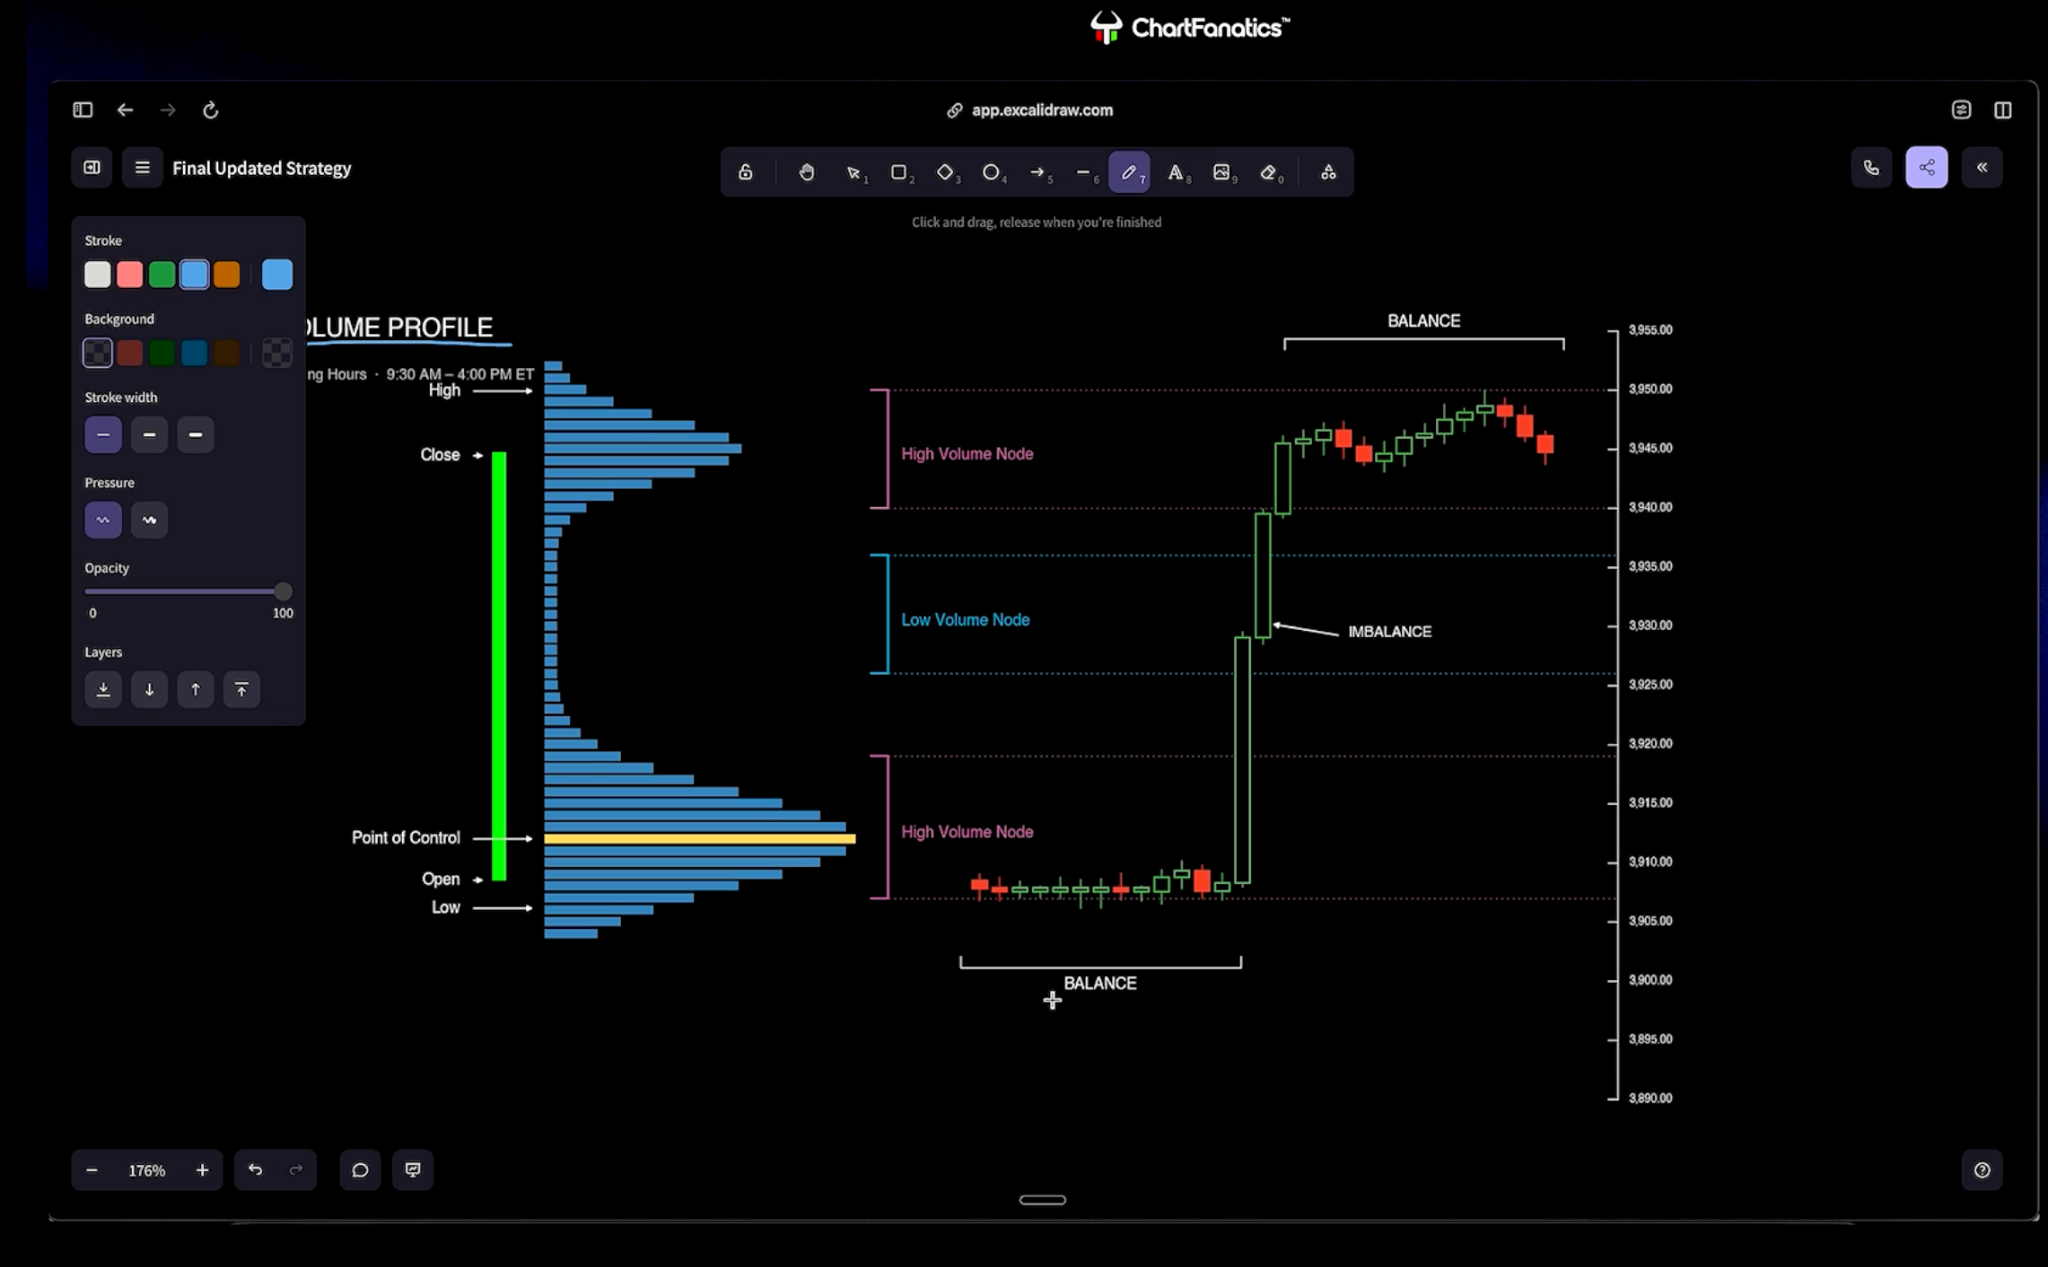
High Volume Nodes (HVNs)
High Volume Nodes are price areas where a large amount of volume has been traded. They commonly develop when the market spends time trading within a range.
A concentration of volume indicates that significant buying and selling activity occurred at those prices.
When price returns to a high-volume area, traders who previously established positions there may become active again. The strategy observes the reaction rather than assuming the level will automatically hold.
Low Volume Nodes (LVNs)
Low Volume Nodes are areas where relatively little volume has been traded. They often develop when price moves quickly through a range without spending much time there.
These areas are important because participants may not have had the opportunity to establish positions during the initial move.
If price returns to the area, those participants may become active. Low Volume Nodes are particularly useful during strong directional sessions when price has moved far away from the previous day’s Value Area.
Value Area
The Value Area represents the price range containing approximately 70% of the volume traded during the selected session. It identifies where most trading activity occurred.
The strategy uses two important boundaries:
- Value Area High (VAH): The upper boundary of the Value Area.
- Value Area Low (VAL): The lower boundary of the Value Area.
These levels are central to determining the market condition. They also provide important trading zones.
Point of Control (POC)
The Point of Control is the price where the greatest amount of volume was traded during the selected period.
It identifies the price with the highest concentration of trading activity.
Along with the Value Area boundaries and Low Volume Nodes, the Point of Control provides another reference for identifying potential trading opportunities.
Balance and Imbalance
Auction Market Theory helps explain how the market moves between periods of balance and imbalance.
- A balanced market develops when buyers and sellers are trading within an established range. Price may move back and forth as the market continues trading within that area.
- An imbalanced market develops when one side gains control and price moves away from the established range.
For example, if the market spends time trading sideways before sellers become more aggressive, price may begin moving lower. The strategy uses this information to understand whether the market is remaining within an established area or beginning a directional move.
Acceptance, Rejection, and Failed Auctions
Acceptance and rejection help determine whether the market is establishing value at new prices or failing to move beyond an important area.
Acceptance occurs when price moves outside an established range and begins trading there. If volume starts building outside the previous area of balance, it indicates that the market is accepting those prices.
For example, if price breaks above a range and continues trading near the highs while volume develops, the market is showing acceptance at higher prices. This suggests that buyers and sellers are willing to transact in the new area.
Rejection occurs when price attempts to move outside an established range but cannot sustain the move.
A failed auction is an example of rejection. For example, if price breaks below the low of a range but quickly returns inside it, the market has attempted to auction lower and failed. This indicates that the market was not ready to establish value at those lower prices.
The distinction is important because a breakout does not automatically mean the market will continue moving in that direction. The strategy evaluates whether price is being accepted outside the range or rejected back into it.
These concepts help identify whether the market is developing a directional imbalance or remaining within an established area of balance.
Market Condition: Identifying Direction and Volatility
The first main trading decision is determining the market condition.
This answers two questions:
- Which direction is the market likely to move?
- Should the market be expected to move aggressively or remain choppy?
The strategy uses the previous day’s Value Area to make this decision. The primary session used for this analysis is Regular Trading Hours (RTH), from 9:30 AM to 4:00 PM Eastern Time.
Previous Day’s Close
The first step is to compare the previous day’s closing price with its Value Area.
- A close above the Value Area provides a bullish signal.
- A close below the Value Area provides a bearish signal.
- A close inside the Value Area does not provide the same directional information because price finished within the area where most trading activity occurred.
This provides the first part of the market condition.
Current Day’s Open
The next step is to compare the current day’s opening price with the previous day’s Value Area. The opening price provides updated information about where the market begins trading during the new session.
The basic conditions are:
- Open above the previous day’s Value Area: Bullish condition.
- Open below the previous day’s Value Area: Bearish condition.
- Open inside the previous day’s Value Area: Potentially balanced or choppy condition.
The opening price is especially important when it conflicts with the previous day’s close.
When Both Signals Agree
A stronger directional condition develops when the previous day’s close and current day’s open are both outside the Value Area in the same direction.
For example, if the previous session closes below its Value Area and the current session opens below that Value Area, both signals are bearish. This suggests a stronger bearish condition and a greater expectation of directional movement.
The same principle applies when both signals are bullish. These conditions provide more conviction than a session where the signals conflict.
When the Signals Conflict
Sometimes the previous day’s close and current day’s open provide different signals.
For example, the previous session may close below value, but the current session opens above value.
In this situation, the opening price takes priority.
The strategy focuses on what the market is doing now rather than relying only on what happened during the previous session. However, the conflicting signals create a lower-conviction condition.
When Not to Trade
If the previous day’s close and the current day’s open are both inside the previous day’s Value Area, the strategy identifies a potentially choppy session.
Under this condition, the decision is not to trade. The purpose is to avoid forcing opportunities when the market does not provide a clear directional advantage. Because the required information is available at the opening bell, the trader can make this decision shortly after the session begins.
Gamma Exposure and Market Behavior
Gamma exposure is another important concept used to understand the market environment and the type of price movement that may develop.
While Volume Profile helps identify the market condition and important trading zones, gamma exposure provides additional information about whether the market is more likely to experience strong directional moves or mean reversion.
The strategy considers how options-market positioning can influence futures prices through hedging activity.
Understanding Gamma Exposure
Gamma is one of the options Greeks. It measures how quickly an option’s delta changes as the underlying market moves.
Delta describes how an option’s value responds to changes in the underlying asset’s price.
When options sellers have exposure to these price movements, they may use futures contracts to hedge their positions.
As the market moves, their delta exposure changes, which can require them to adjust their futures positions. This hedging activity can contribute to market movement.
The strategy focuses primarily on two gamma environments:
- Negative gamma
- Positive gamma
Understanding the difference helps determine what type of price behavior to expect around important trading levels.
Negative Gamma Environment
In a negative gamma environment, the strategy expects a greater possibility of strong directional movement, volatility, and breakouts.
Casper explains that options sellers may need to hedge in the direction of the market’s movement. This means their hedging activity can reinforce an existing move.
For example, when the market moves lower, the hedging activity may contribute additional selling pressure. When the market moves higher, it may contribute additional buying pressure.
Because of this behavior, the strategy focuses more on breakouts and acceptance beyond important levels during negative gamma conditions.
If price moves through a significant Volume Profile level and begins establishing acceptance beyond it, the environment may support further directional movement.
However, negative gamma does not guarantee that every breakout will continue. The trader still evaluates the market’s reaction and whether price is being accepted or rejected.
Positive Gamma Environment
In a positive gamma environment, Casper expects more mean reversion, meaning more reversals at important levels.
Mean reversion is when price moves away from an established area and then comes back toward it. So instead of expecting every breakout to turn into a strong trend, the trader watches for reversals around important levels.
For example, price may move away from an established Value Area but fail to hold the move. If the market rejects those prices and returns toward the previous area of value, that fits a mean-reverting environment.
The key difference:
- Negative Gamma: More volatility, breakouts, and moves that keep going in one direction.
- Positive Gamma: More mean reversion and reversals.
These are expectations, not guarantees.
Gamma Exposure Levels
In addition to identifying the gamma environment, the strategy considers important gamma exposure levels.
These levels help identify prices where options-related hedging activity may become relevant.
For example, in a negative gamma environment, if price breaks below an important gamma level, Casper expects the possibility of a strong expansion move. These levels help identify where significant directional movement may develop.
Casper uses a daily report containing gamma information to help prepare for the trading session.
The report provides context about the broader environment and important levels to watch.
However, gamma exposure levels do not automatically provide trade entries.
The trader still evaluates whether price is being accepted or rejected at those levels and whether the market is demonstrating the expected directional movement.
Combining Gamma With Volume Profile
Gamma exposure is used alongside Volume Profile rather than replacing it.
Volume Profile identifies the important areas where trading activity has occurred. Gamma provides additional context about how the market may behave when price reaches those areas.
For example, suppose the market opens below the previous day’s Value Area, creating a bearish condition.
If the gamma environment is also negative, the strategy has additional context for expecting a potentially strong directional move. When price reaches an important Volume Profile level, the trader evaluates whether the market can establish acceptance beyond it.
If price breaks lower and volume begins developing below the level, that acceptance can support the expectation of continued downside movement. However, if the market attempts to break lower but quickly returns above the level, the move may represent rejection or a failed auction.
The gamma environment does not override what the market is actually doing. The strategy continues to evaluate the reaction at the level before making a trading decision.
How Gamma Fits Into the Strategy
Gamma exposure provides additional context for the first trading decision: identifying the market condition.
The previous day’s Value Area helps establish the initial directional bias. Gamma helps determine whether the broader environment may favor strong directional movement or mean reversion.
Gamma mainly adds context to the market condition, although gamma levels can also act as important prices to watch. Depending on the environment, gamma can influence how aggressively a trade is taken and managed.
The complete process is still:
Market Condition → Trading Zones → Entry Triggers → Trade Management
Gamma helps explain the expected market behavior, while Volume Profile, market structure, and order flow provide the information needed to identify and execute trades.
Trading Zones: Where to Look for Opportunities
Once the market condition is established, the second decision is identifying where trades may develop. Knowing whether the market is bullish or bearish is not enough.
The strategy also requires specific price areas where other participants may become active. These levels are primarily identified using the previous day’s Volume Profile.
Previous Day’s Important Levels
The main trading zones are:
- Value Area High (VAH)
- Value Area Low (VAL)
- Point of Control (POC)
- Previous day’s VWAP
- Low Volume Nodes (LVNs)
These levels are marked before trading. When price reaches one of them, the trader begins looking for an entry trigger.
For example, if the market opens below the previous day’s Value Area, the initial condition is bearish.
If price rallies toward a previous-day level, that area becomes a potential location to look for sellers.
However, the level itself does not provide the entry. The market must demonstrate the expected reaction.
Why Previous-Day Levels Matter
These levels represent areas where trading activity occurred during the previous session.
Participants who established positions around those prices may respond when the market returns.
For example, traders who previously sold near an important level may become active again when price approaches it.
The strategy attempts to identify these reactions. The objective is not necessarily to capture an entire trend from every level.
Even a smaller movement away from an area where participants are likely to act can provide a trading opportunity.
Gap-and-Go Conditions
A special situation occurs when the market moves a significant distance away from the previous day’s Value Area. This can happen when the previous close and current open support a strong directional condition or when a large overnight move suggests strong directional intention.
Casper refers to this as a gap-and-go environment.
For example, suppose the market has moved significantly lower overnight and the condition is bearish.
Waiting for price to retrace all the way to the previous day’s Value Area Low may cause the trader to miss the move. Instead, the strategy looks for the first relevant trading level.
Low Volume Nodes During Strong Moves
Low Volume Nodes become particularly important during gap-and-go conditions.
If the market previously moved quickly through an area, relatively little trading activity may have occurred there.
Participants who wanted to establish positions during that move may not have had the opportunity. When price returns to the area, those participants may become active.
A nearby Low Volume Node can therefore provide an earlier location to look for a trading opportunity.
The objective is to recognize when the market is already showing strong directional intent rather than waiting for a large retracement that may never occur.
Entry Triggers
The third main trading decision is determining when to enter. After identifying the market condition and trading zone, the strategy waits for confirmation that the expected side is beginning to take control.
Two entry methods are explained:
- A market structure shift on the two-minute chart.
- Order flow absorption.
Both methods are used at relevant trading zones.
Entry Model 1: Two-Minute Market Structure Shift
The first entry method uses market structure on the two-minute timeframe.
- For a bearish setup, the trader waits for a candle to close below a relevant swing low.
- For a bullish setup, the corresponding signal is a candle closing above a relevant swing high.
The candle close is important because the entry requires a confirmed structure shift rather than a brief move beyond the swing. The stop is placed beyond the relevant swing that invalidates the setup.
- For a short position, the stop is placed above the swing high.
- For a long position, the stop is placed below the swing low.
Casper explains that he tested the one-minute through five-minute charts using a large dataset from trading software he is building, and the two-minute chart had the highest success rate. This provides a straightforward entry method without requiring detailed order flow analysis.
Entry Model 2: Order Flow Absorption
The second entry method uses absorption. Absorption occurs when aggressive traders repeatedly buy or sell into an area, but their activity fails to move price in the expected direction. This suggests that passive participants are taking the opposite side of those orders.
For example, suppose the market condition is bullish, and price reaches an important trading zone. Aggressive sellers begin selling into that area. However, despite repeated selling, price does not continue moving lower. Instead, the market holds the area because passive buyers are absorbing the selling pressure.
If sellers continue entering without achieving further downside movement, they may become trapped. When aggressive buyers begin participating and price starts moving higher, those trapped sellers may need to exit. Their exits can contribute to the upward movement.
The bearish version follows the opposite logic.
Aggressive buyers repeatedly buy into an important level, but passive sellers absorb the buying. If buyers fail to push price higher and sellers begin taking control, the market may move lower.
Absorption provides information about what buyers and sellers are actually doing at the trading zone.
Aggressive and Passive Orders
Understanding absorption requires distinguishing between aggressive and passive orders.
- Aggressive traders use market orders to execute immediately. They are willing to transact at the available market price.
- Passive traders use limit orders to transact at specified prices.
The strategy evaluates how these two groups interact. Aggressive selling does not automatically mean price will move lower.
If passive buyers continue absorbing the selling, the market may hold the level despite significant selling activity.
The important question is whether aggressive participation produces the expected price movement.
Using Order Flow to Confirm Control
Order flow helps identify whether buyers or sellers are achieving the expected movement.
For example, aggressive sellers entering while price continues falling indicates that selling pressure is producing results. However, if sellers repeatedly enter and price does not continue lower, the selling may be failing.
The same principle applies to aggressive buying.
The strategy focuses on the relationship between trading activity and the resulting price movement. This is particularly important when identifying absorption and trapped traders.
Reloading Limit Orders
Reloading is another order flow behavior used to evaluate whether large market participants are continuing to buy or sell.
It occurs when a passive participant continues placing limit orders as price moves.
For example, a large seller may initially have limit sell orders at a particular price. After those orders are filled, the seller may continue placing additional sell orders at lower prices.
This indicates that the participant is willing to keep selling as the market moves lower.
The strategy watches for this behavior because it can provide additional information about which side is controlling the market.
During a bearish move, continued selling aggression combined with passive sellers reloading at lower prices can support the expectation of further downside movement.
Reloading is not a separate entry model. It is an order flow behavior that helps evaluate the strength of buying or selling activity.
Risk Management and Stop-Loss Placement
Risk management begins with identifying where the trade idea becomes invalid.
The strategy does not use the same fixed stop distance for every setup. Instead, stop placement depends on the entry method and the market structure surrounding the trade.
Stops Based on Market Structure
When entering after a two-minute market structure shift, the stop is placed beyond the relevant swing.
- For a short position, the stop is placed above the swing high.
- For a long position, the stop is placed below the swing low.
The stop identifies the area where the expected market structure would no longer support the trade.
Stops Based on Absorption
When entering through absorption, the invalidation point can be based on the area where the absorption occurred.
For example, if passive sellers absorb aggressive buying near a high, the stop can be placed beyond the area that would invalidate the bearish setup.
This may allow a more precise stop than waiting for a later market structure shift. However, the stop must still reflect where the original trading idea becomes invalid.
Position Sizing
Position size changes with the quality of the trade and the market conditions.
Casper does not believe in risking the same amount on every trade. He calls fixed rules like risking 1% on every trade illogical, because they treat every setup the same.
For example, Casper explains that if a setup has a higher win rate but a lower risk-to-reward, he risks more on early trades in a trailing drawdown.
Risk also reflects how strong the setup is. A trade that lines up with the market condition, an important trading zone, and a clear entry trigger may justify more risk than a weaker one.
Countertrend trades get lighter risk because they go against the main market direction. In one live trade, Casper took a countertrend long at about half his normal risk and moved his stop up quickly to lock in gains.
The goal is to set risk based on each opportunity, not to use the same size or dollar risk on every trade.
Trade Management: Letting Winners Run
Trade management is one of the most important parts of the strategy. Instead of exiting at a predetermined profit target, the approach focuses on remaining in a position while the market continues supporting the trade. The principle is to let winners run and cut losers quickly.
A winning trade is one where the trader is positioned with the side currently controlling the market. The goal is to remain involved while that control continues.
No Fixed Take-Profit Orders
The strategy does not use fixed take-profit orders.
A fixed target requires the trader to decide in advance how far the market should move. Casper instead uses important price levels as areas to begin managing the position.
A level that another trader might use as a profit target becomes a place to evaluate the market’s reaction and adjust the stop.
For example, if a short position reaches an important lower level, the trade is not automatically closed.
Instead, the trader evaluates whether sellers remain in control.
If the market continues lower, the position may remain open.
If buyers begin taking control, the stop can be adjusted to protect the position.
Trailing the Two-Minute Structure
The simpler management method uses swing points on the two-minute chart.
- For a short trade, the stop can be moved above newly formed lower highs.
- For a long trade, the stop can be moved below newly formed higher lows.
As new swing points form, the stop is adjusted to follow the developing market structure. This allows the trade to continue while the expected side remains in control. If the market reverses enough to reach the adjusted stop, the position is closed.
Managing Trades With Order Flow
Order flow provides another way to manage a position. Instead of relying only on swing points, the trader observes aggressive buying and selling, absorption, and the behavior of participants around important levels.
For example, during a short trade, aggressive selling may continue pushing price lower while buyers fail to produce a meaningful response.
This supports remaining in the position.
However, if buyers begin taking control or sellers stop achieving further downside movement, the trader may need to protect the position more aggressively.
The objective is to recognize when the market is no longer supporting the original trade.
Reducing Risk as the Trade Develops
As a position becomes profitable, the stop can be adjusted to reduce exposure.
This may involve moving the stop closer to the entry or trailing it behind newly formed market structure.
The goal is to protect the position while allowing enough room for the expected movement to continue.
The strategy accepts that some trades may stop out after initially moving in the expected direction.
The objective is to keep losses controlled while allowing stronger winning trades to develop.
Trading Performance and Consistency
The strategy also emphasizes the importance of reviewing trading performance. Casper explains that some of the most important improvements in his trading came from examining his own results rather than constantly searching for new strategies.
Reviewing Trade Data
One of the important discoveries came from reviewing how far trades continued moving after he exited. He found that many positions continued significantly beyond his original profit-taking areas. This led him to focus more heavily on trailing stops rather than fixed take-profit orders.
The objective was to capture more of the movement when the market continued supporting the position.
Average Realized Risk-to-Reward
Casper also emphasizes examining average realized risk-to-reward across a larger sample of trades.
Improving the amount captured from winning trades can significantly affect overall performance. The strategy does not depend on predicting every move correctly.
Instead, it focuses on controlling losses and allowing larger winning trades to contribute more to the overall results.
The Complete Trading Process
The strategy follows a repeatable process built around the three main trading decisions.
Step 1: Determine the Market Condition
- Review the previous day’s regular-session Value Area.
- Compare the previous day’s close and current day’s open with that Value Area.
- Determine whether the initial condition is bullish, bearish, or choppy.
- When both directional signals agree, the condition has greater conviction.
- When they conflict, prioritize the opening price.
- If both the close and open are inside value, the initial condition filter indicates no trade.
- Check the gamma environment. Negative gamma favors breakouts and directional moves. Positive gamma favors mean reversion.
Step 2: Mark the Trading Zones
- Identify the previous day’s VAH, VAL, POC, VWAP, and relevant LVNs. These levels provide the main areas where the trader will look for opportunities.
- During strong gap-and-go conditions, pay attention to nearby LVNs rather than waiting only for a large retracement.
Step 3: Wait for Price to Reach a Zone
- Allow the market to approach one of the identified levels.
- Do not enter solely because the market condition is bullish or bearish.
- Observe how price responds when it reaches the area.
- The strategy requires both a meaningful location and an entry trigger.
Step 4: Identify the Entry Trigger
At the trading zone, look for one of the two entry methods:
- A confirmed market structure shift on the two-minute chart.
- Order flow absorption showing that aggressive participants are failing to move price through the area.
Evaluate whether the market’s response supports the expected direction.
Step 5: Define the Stop-Loss
- Place the stop beyond the relevant market structure or absorption area.
- Set the risk on the trade based on the quality of the setup, with lighter risk on countertrend trades. The stop should reflect where the trade idea becomes invalid.
Step 6: Manage the Position
- Once the trade is open, monitor whether the expected side remains in control.
- Use two-minute structure or order flow to adjust the stop.
- As price reaches important levels, evaluate the market’s reaction rather than automatically taking profit.
Step 7: Exit When the Trade Is Invalidated
- Remain in the position while the market continues supporting the expected direction.
- Adjust the stop as the market develops.
- Exit when the stop is reached or the market demonstrates that the original advantage is no longer present.
- The strategy does not require a fixed take-profit target.
Trade Breakdown
Trade Example 1: NASDAQ Long Using Volume Profile and Absorption
Instrument: NASDAQ Futures (NQ)
Direction: Long
Trading Zone: Previous Day’s Value Area High (VAH)
Entry Trigger: Order Flow Absorption
Stop-Loss: Below the absorption area
Exit: Trailing stop
Market Condition
The market opened above the previous day’s Value Area, so the condition was bullish.
FOMC was the day before, and most traders expected a rate hike that didn’t come. The market had been selling off hard before that, so late short sellers looked likely to get squeezed. The mid to long term view was still bearish, but the short-term expectation was bullish.
Trading Zone
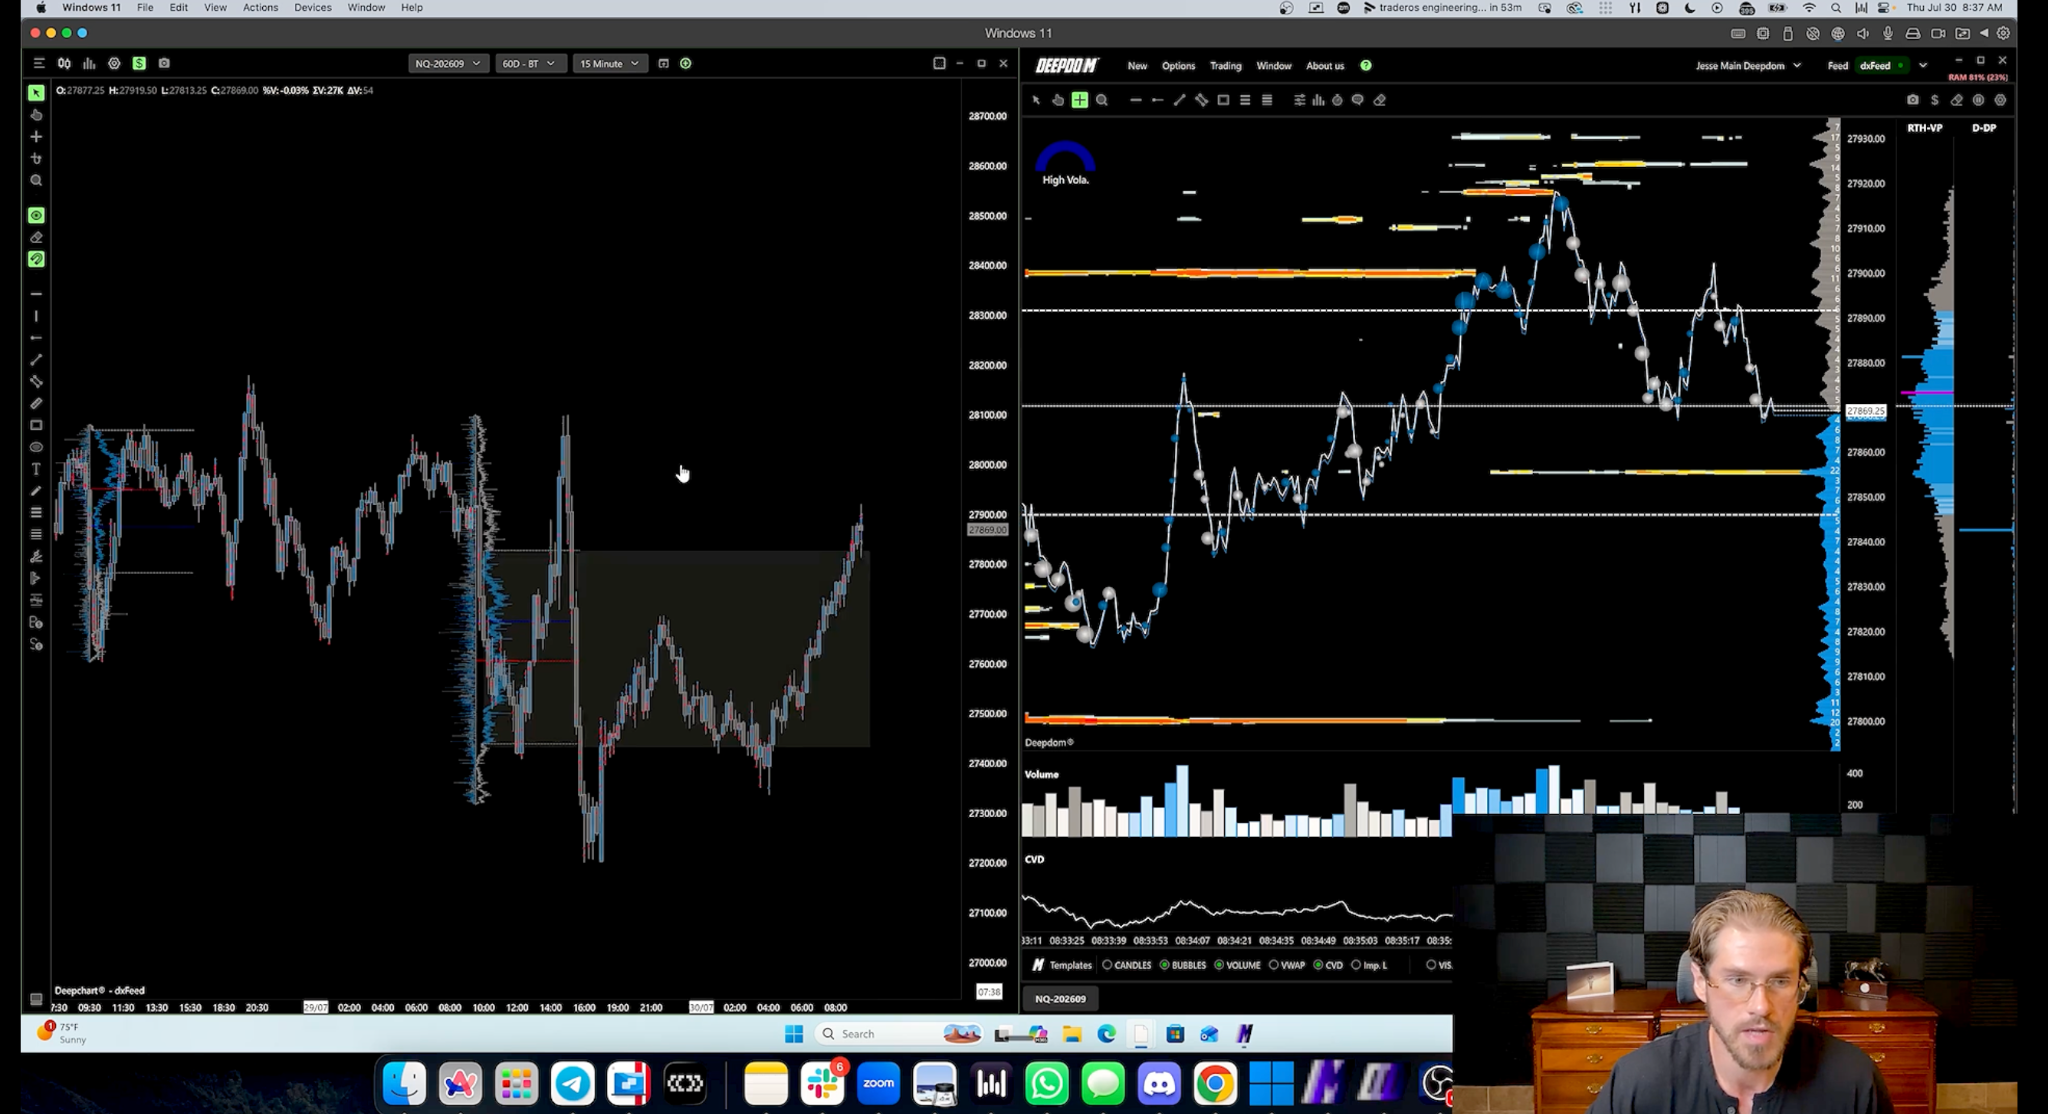
Price traded down into the previous day’s Value Area High, which was the zone for this trade.
Entry Trigger
At the Value Area High, aggressive sellers sold into an area of passive buyers. The passive buyers absorbed the selling, and the market popped higher. This is absorption: the sellers were now trapped.
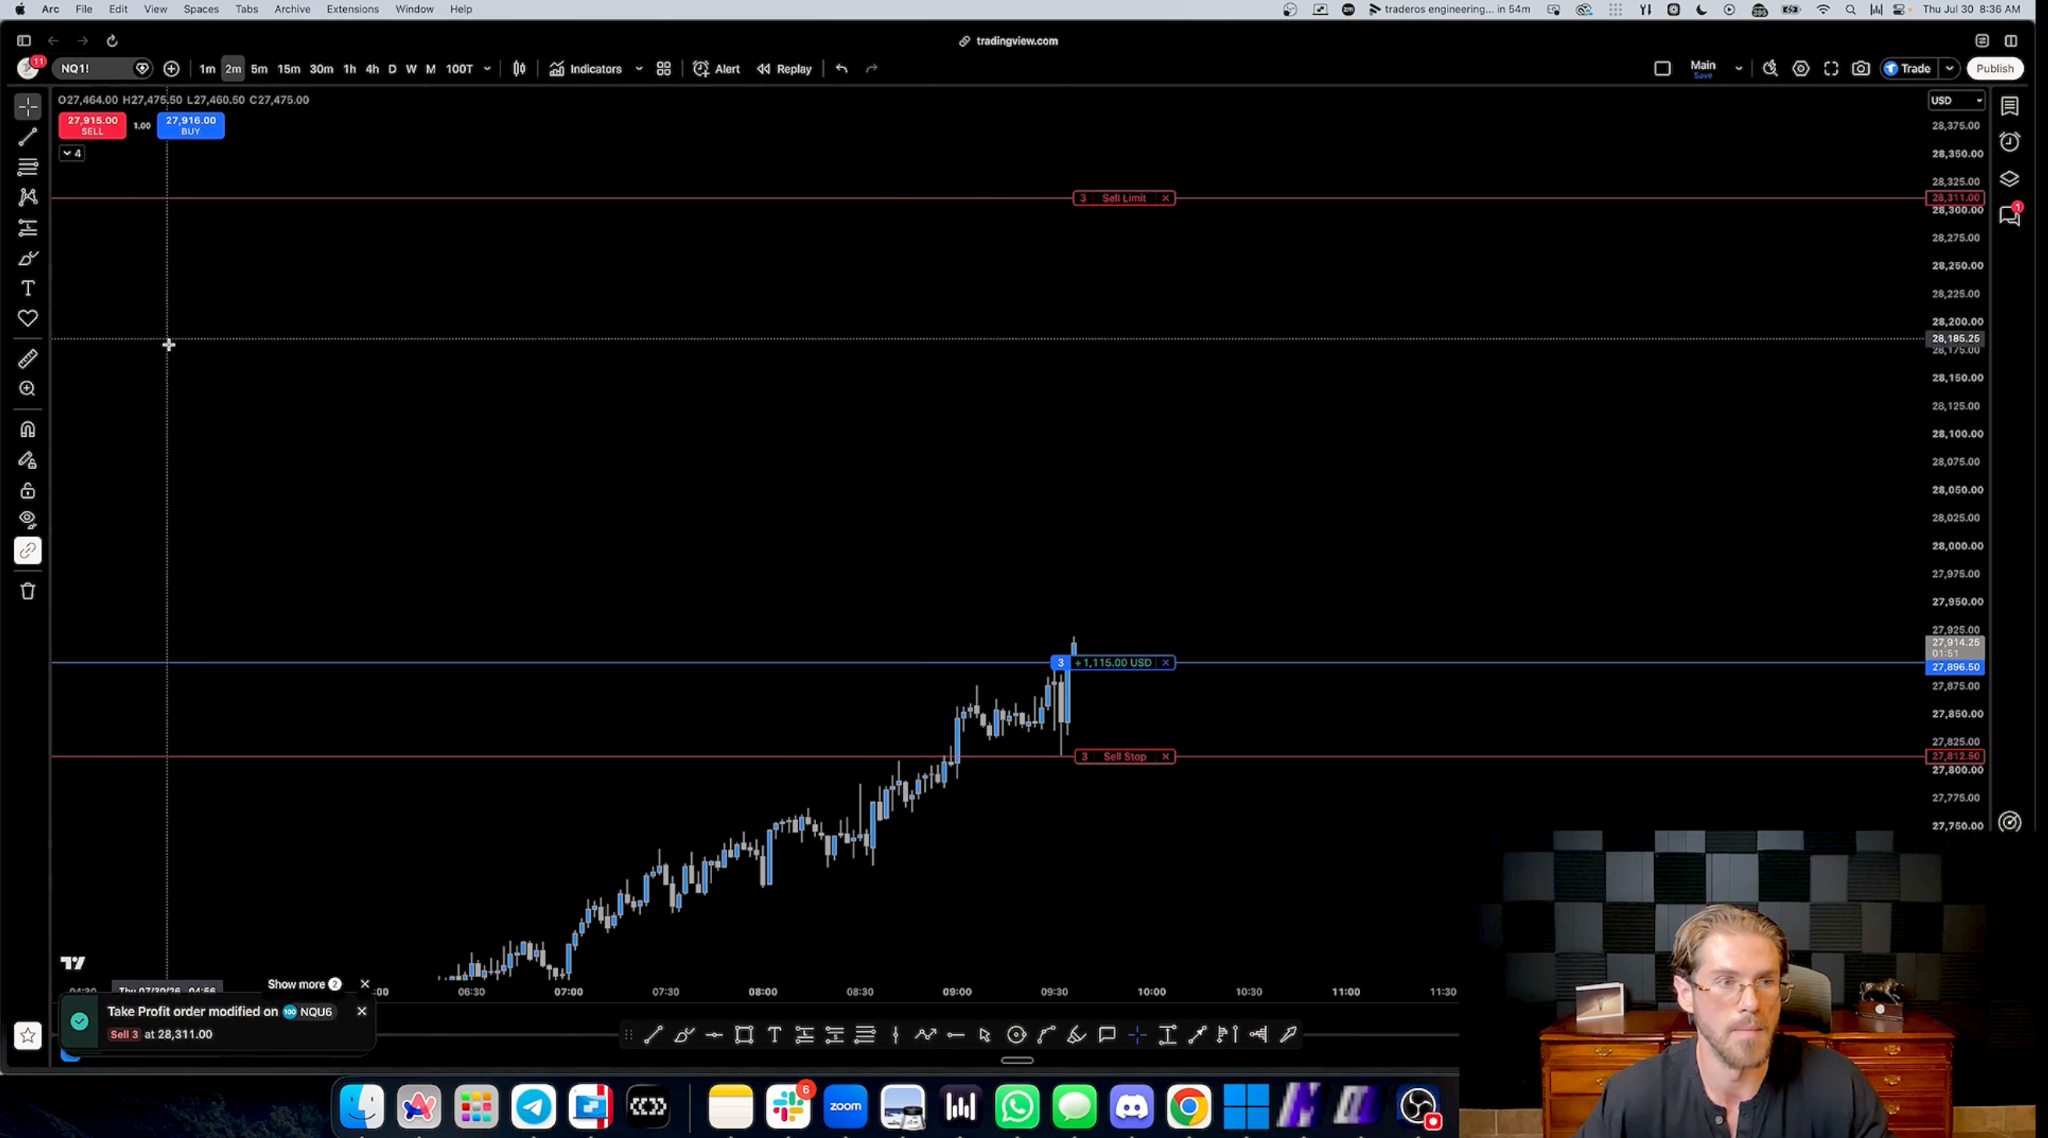
The trade was entered long with 3 contracts and a slightly wider stop to give it decent room.
Stop Placement
The stop went under the low of the area where the sellers got trapped. As long as price stayed above that low, the sellers were still trapped, with a bullish reason for it.
Price dipped back into the entry area, and that was fine. That area works a bit like an order block: it’s where the other side was wrong, and price can come back to it several times. What matters is how price forms balance there and whether it can break above it.
Contingency Plan
If the stop was hit and price was then accepted lower, that could set up a short. The bullish condition, zone and trigger would have failed, which would show someone was really trying to push the market down.
Trade Management
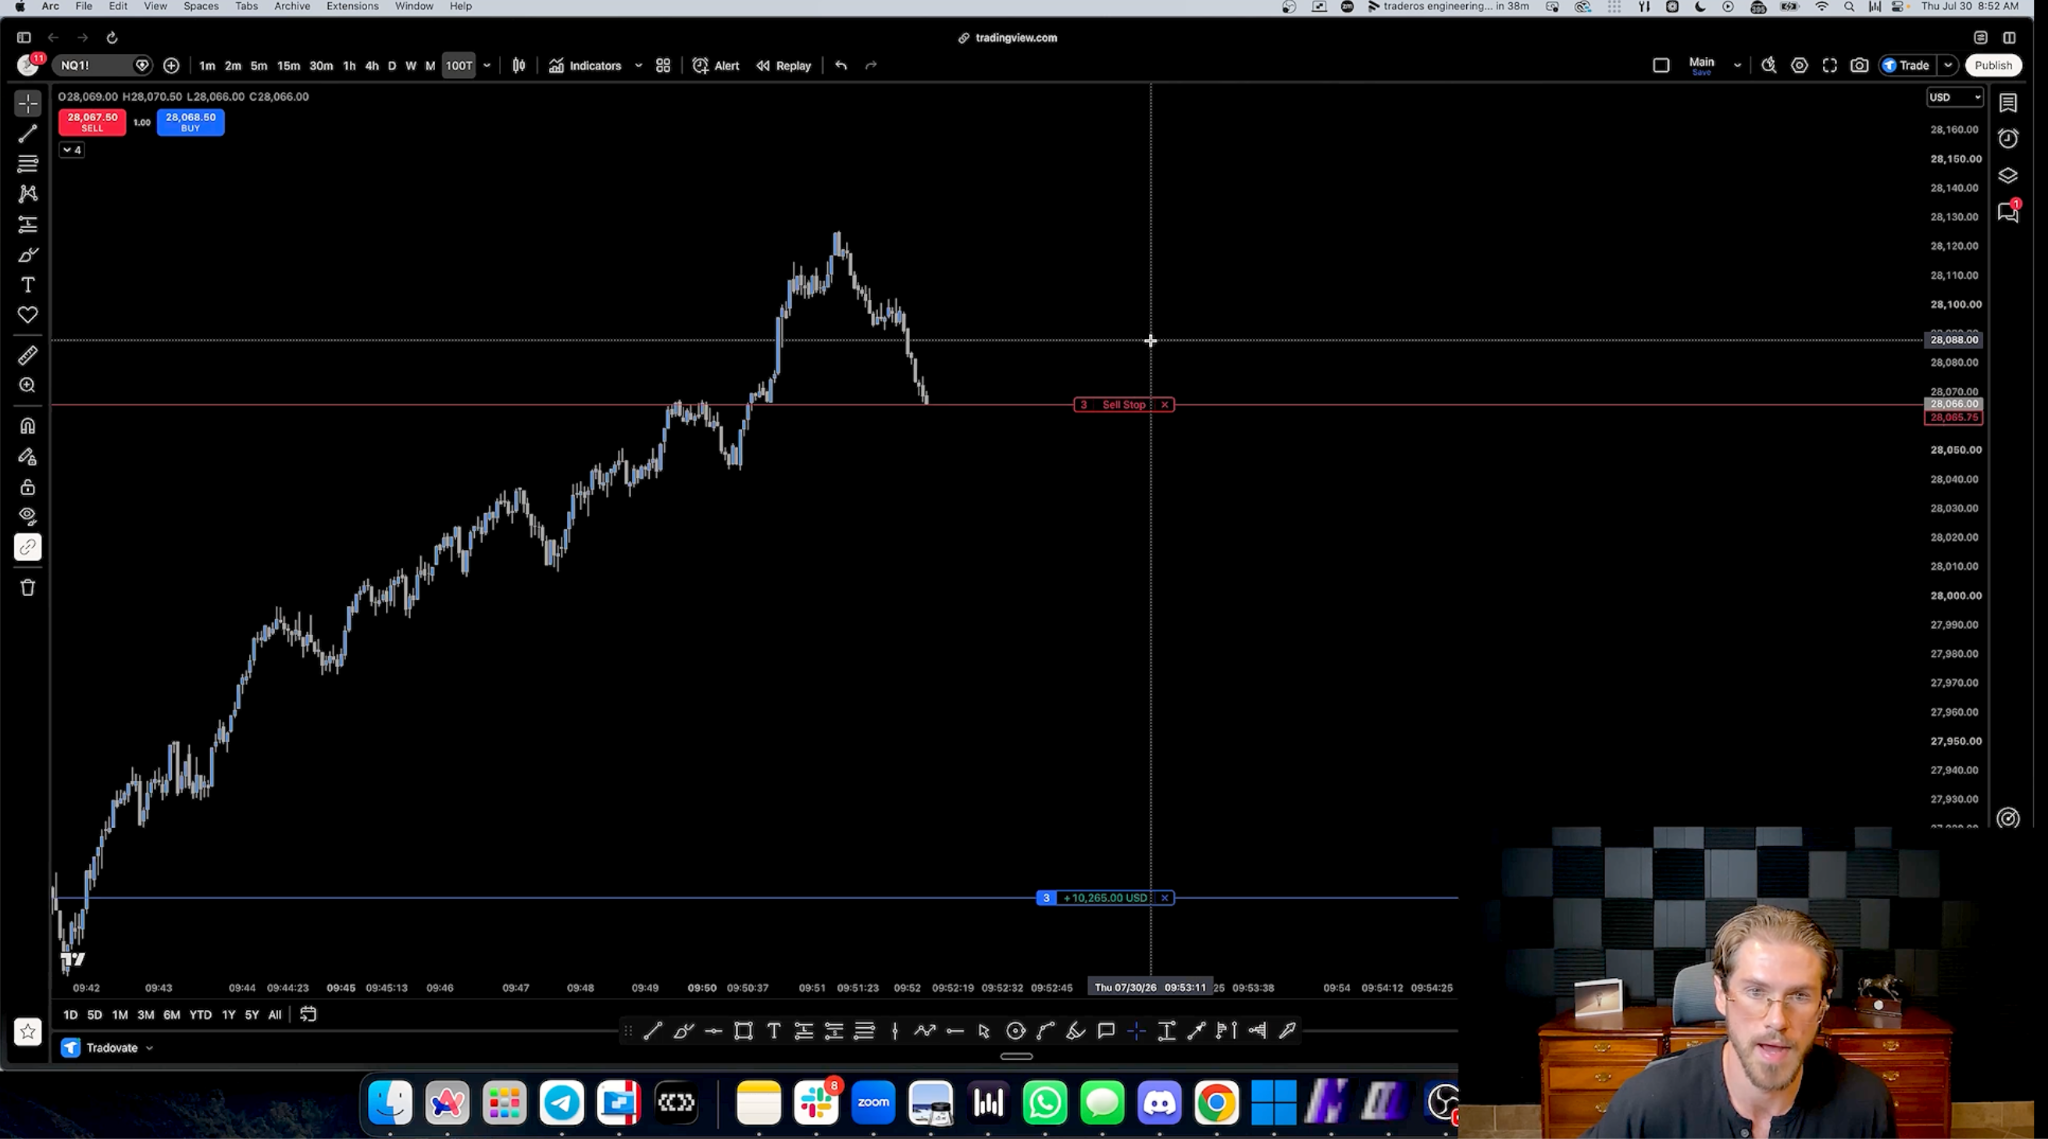
- Price broke above the old range high and moved sideways above it without selling off. That was acceptance, so the stop moved to breakeven.
- With about $5,600 open profit, the trailing got more aggressive. Price was getting close to 28,000, a round number where problems were likely.
- With about $6,000 open profit, the stop was tightened again near 28,000.
- As the move picked up, the stop moved under each new pivot. The question each time was where the other side was wrong.
- Sellers came in hard at one point, but buyers held the move. That was a stronger bullish sign, so the stop was trailed up again.
There was no take-profit order. The take-profit line stayed on the chart only so it could be dragged for a fast exit if needed.
Exit
The trailing stop was hit, and the day closed about $10,000 up.
Trade Recap
- Condition: opened above the previous day’s Value Area, bullish.
- Zone: the previous day’s Value Area High.
- Trigger: passive buyers absorbed aggressive sellers, and CVD rose as aggressive buyers stepped in.
- Management: after the second confirmation, the stop was trailed up every time sellers were proven wrong.